Visibility
Introduction
The Aspecto platform uses a graphical user interface web management interface for all components available to the user. This guide describes the Visibility menus and options in the web management interface.
Organization of the Manual
This guide contains the following chapters and appendix:
- Visibility Menu
This chapter covers the Visibility menu. It describes how to discover services and clients, and how to work with SQL statements. This function was formerly known as Discovery.
- APPENDIX A - Glossary
This appendix defines the technical terms in this manual.
Visibility Menu
| This chapter describes the options in the Visibility menu. |
Services
Path: Visibility > Services > Service Discovery
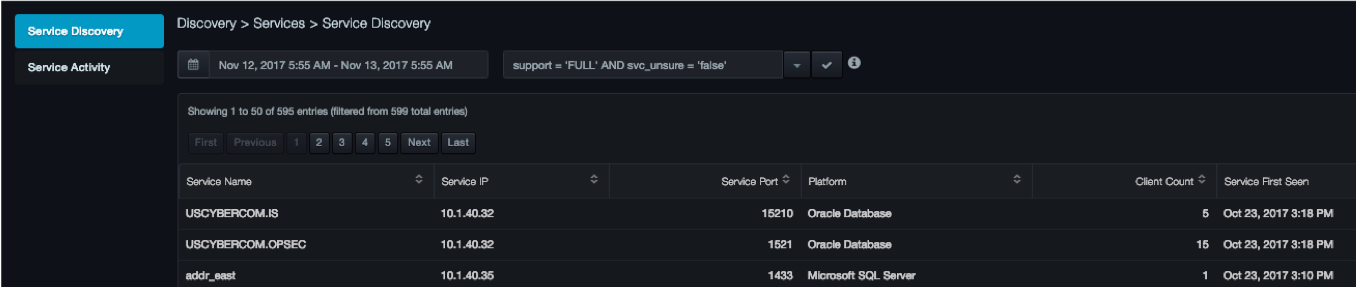 The Service Discovery page lists all of the database services that DBC platform has discovered. The earliest discovered service appears at the top of the list.
Columns in the Service Discovery Page
| Column | Description |
|---|---|
| Service Name | Name of the service as it was discovered. |
| Service IP | IP address that the service is using. |
| Service Port | Number of the port on which the service is listening. |
| Platform | Database platform the service is using. |
| Client Count | Number of clients accessing a particular service. |
| Service First Seen | Date and time when DBC platform saw the service for the first time. |
Service Activity
Path: Visibility > Services > Service Activity
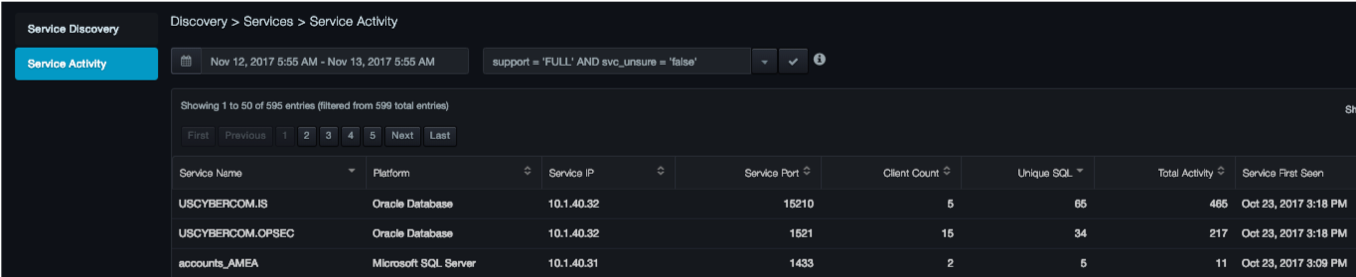 The Service Activity page shows the activity associated with each database service. Viewing how busy a database
service is allows administrators to identify which databases should be monitored more often than others.
The Service Activity page shows the activity associated with each database service. Viewing how busy a database
service is allows administrators to identify which databases should be monitored more often than others.
Columns in the Service Activity Page
| Column | Description |
|---|---|
| Service Name | Name of the service as it was discovered. |
| Platform | Database platform the service is using. SQL Server, Oracle, Db2 Mainframe, Db2 LUW |
| Service IP | IP address that the service is using. |
| Service Port | Number of the port on which the service is listening. |
| Client Count | Number of clients connected to the service. |
| Unique SQL | Number of distinct SQL statements executed against the service. |
| Total Activity | Number of SQL and RPC executions against the service. |
| Service First Seen | Date and time when the platform saw the service for the first time. |
Client Visibility and Activity
Path: Visibility > Clients
Visibility > Clients provides the following submenus in the left pane:
-
Client Discovery — shows each client, the specific service to which the client is connected, the times when each client became visible to the DBC platform, and the corresponding client IP address.
-
Client Activity — shows the activity levels of individual clients.
Client Discovery
Path: Visibility > Clients > Client Discovery
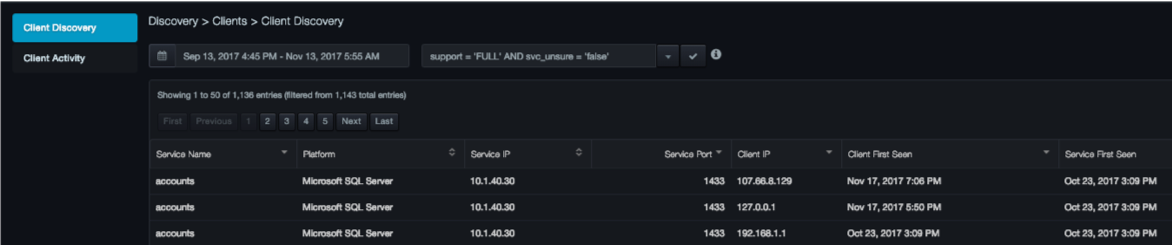 The Client Discovery page shows which clients are connected to which databases, the times when each client became visible to the DBC platform, and each service’s client IP address. This client mapping information can alert database administrators and security services to the unexpected appearance of a client, which might signal an unauthorized intrusion.
Columns in the Client Discovery Page
| Column | Description |
|---|---|
| Service Name | Name of the service as it was discovered. |
| Platform | Database platform the service is using. |
| Service IP | IP address that the service is using. |
| Service Port | Number of the port on which the service is listening. |
| Client IP | IP address that the client is using. |
| Client First Seen | Date and time when DBC platform saw the client for the first time. |
| Service First Seen | Date and time when DBC platform saw the service for the first time. |
Client Activity
Path: Visibility > Clients > Client Activity
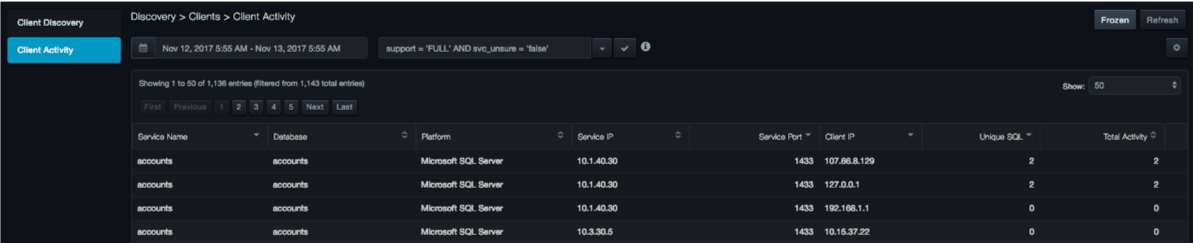 The Client Activity page shows the activity levels of individual clients. This view helps you understand the
relationship of each client, application, and database. Table 1‑4 describes the columns in the page.
The Client Activity page shows the activity levels of individual clients. This view helps you understand the
relationship of each client, application, and database. Table 1‑4 describes the columns in the page.
Columns in the Client Activity Page
| Column | Description |
|---|---|
| Service Name | Name of the service as it was discovered. |
| Platform | Database platform the service is using. |
| Service IP | IP address that the service is using. |
| Service Port | Number of the port on which the service is listening. |
| Client IP | IP address that the client is using. |
| Unique SQL | Number of distinct SQL statements executed against the service. |
| Total Activity | Number of SQL and RPC executions against the service. |
Interconnections
Path: Visibility > Interconnections
The Interconnections page provides a visual representation of traffic patterns between clients and database services. Using this page, you can identify:
-
The clients and database services that DBC platform has discovered.
-
Which entities are communicating with each other.
-
What the entities are communicating.
The following figure shows an example of an interconnection diagram.
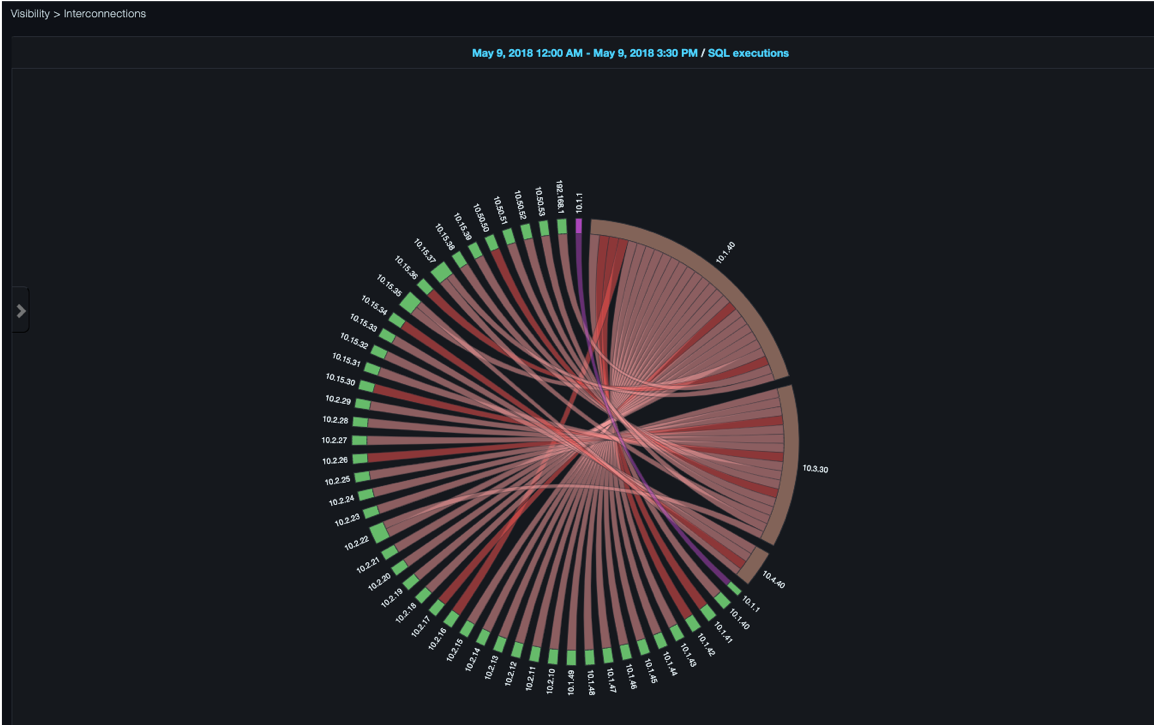
By default, the interconnection diagram tries to show all discovered clients and all services in a single diagram. Depending on your environment, however, a single diagram might not be able to show all entities legibly. In large, complex environments where the number of clients and database services reaches a certain threshold, the interconnections diagram aggregates clients and/or services according to their subnet.
If the aggregated view does not generate a legible diagram, you can view a narrower time range to limit the number of clients and services shown in the diagram. To magnify the font and enhance readability, hover your pointer over a client or service label.
If a group of services is aggregated by subnet, and there are multiple platforms from a group of clients (for example, some clients execute Oracle SQL while others execute MS SQL Server statements), the subnet appears as Mixed.
Observe the following when viewing the diagram:
-
Clients and services in the interconnection diagram are positioned in a circle.
-
Interactions between a client and a service are illustrated with a connecting line between the two entities.
-
Services or service subnets start at the 12:00 position on the circle. Clients and client subnets appear in the remaining area around the circle.
-
The interconnection line between a client and a service indicates activity. The width of the connector corresponds to the amount of activity (thin for minimal activity or wide for substantial activity).
-
The connector color indicates the database SQL platform of the client’s SQL statements.
Drilling Down into an Entity
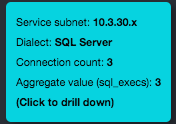
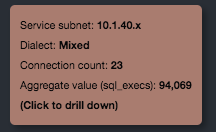
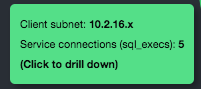
Hovering your mouse pointer over an IP address or subnet enlarges the IP address and displays a tooltip with information about the entity (see the examples below). It also highlights the entity’s label, connectors, and endpoint connections.
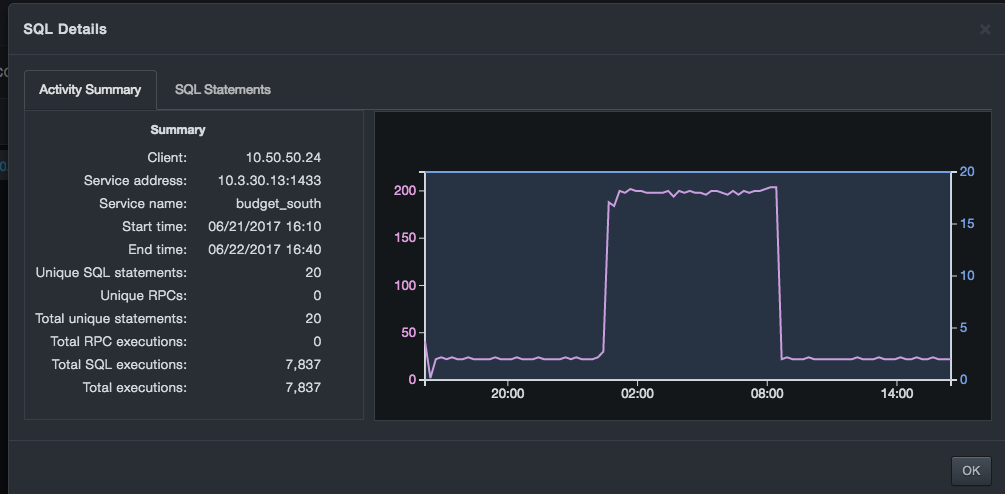
You can continue clicking subnets until you reach the lowest level, which is a single client connection to a single database service IP, port, and service name. When you reach the lowest level, a SQL Details dialog box similar to the following appears. The dialog box provides two tabs:
-
Activity Summary
-
SQL Statements
When you finish using the SQL Details dialog box, click OK at the bottom-right of the dialog box to close it.
Activity Summary Tab
The Activity Summary tab shows summary information for the specific client and service, and summary statistics for the specified time period. A graph containing two data series provides a high-level view of the "shape" of the data. If you scroll your mouse left and right over the graph, the values for the data series for that point in time appear below the graph.
If SQL executions or Unique SQL statements are specified as the metric in the Options page, the graph shows SQL executions and Cumulative new SQL as a line and area data series, respectively.
-
The SQL executions metric indicates the level of activity over the selected time period.
-
The Cumulative new metric represents the extent to which a client demonstrates new behaviors.
If the RPC executions or RPC statements are specified as the metric in the interconnections diagram, the graph shows the RPC equivalent metrics.
SQL Statements Tab
The SQL Statements tab contains a list of the SQL statements that the DBC platform observed between this client and this database service. Statements are presented in tabular format, with support for paging, sorting, and searching.
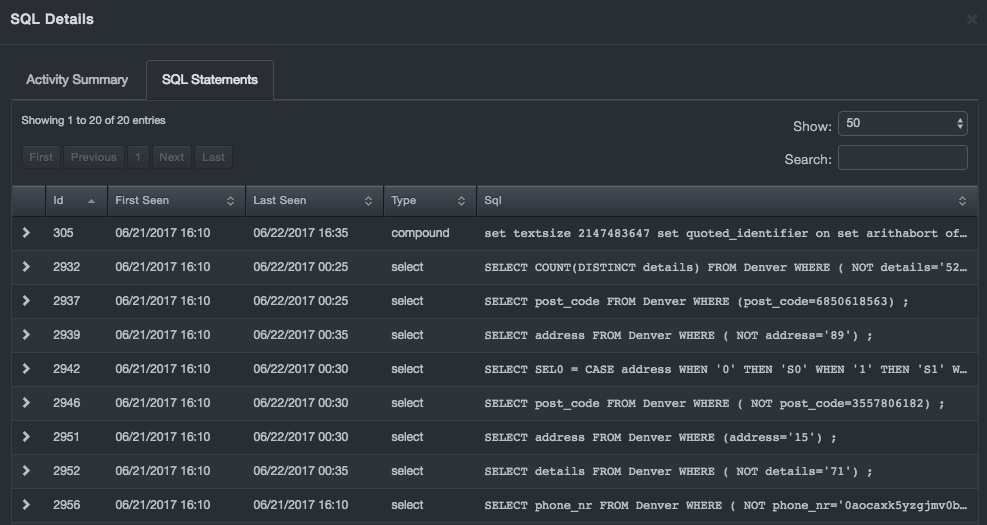
The First Seen and Last Seen columns show the first time and last time the SQL statement was seen between this client and service, even if the values are outside the time period you selected in the Display Options page for the interconnections diagram. As a result, you can determine whether a particular SQL statement is a new type of interaction between a client and service. An OK button at the bottom-right closes the tab.
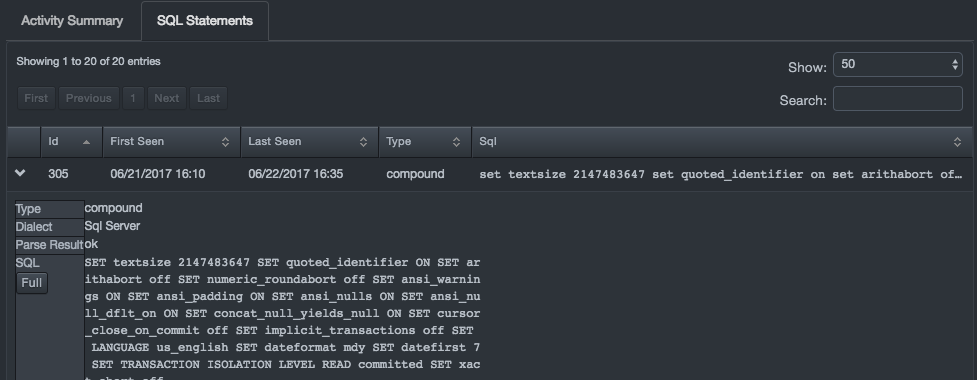
-
To display expanded formats of an SQL statement click the arrow at the left of the statement.
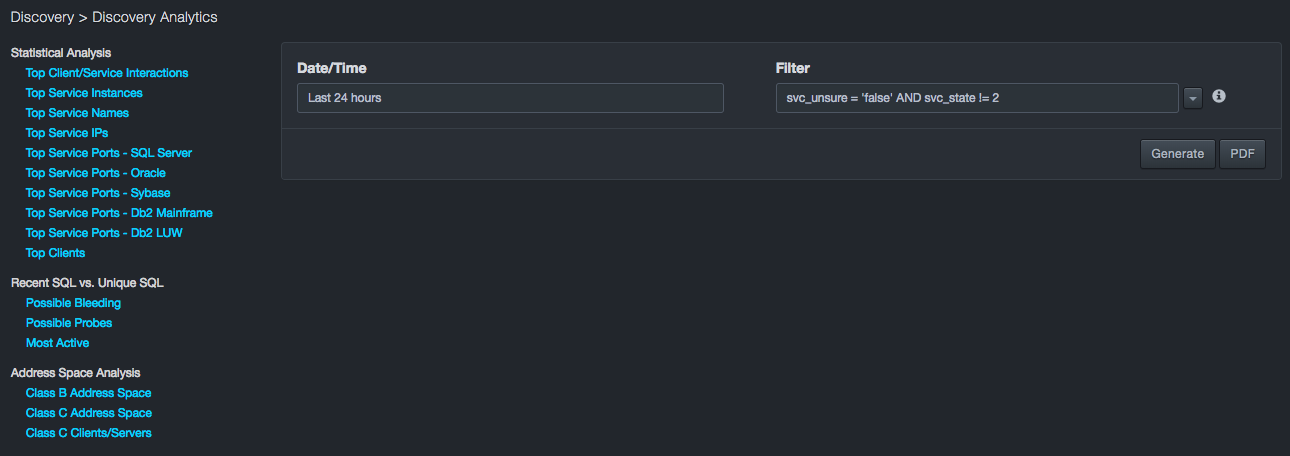
Discovery Analytics
Path: Visibility > Discovery Analytics
The analytics report contains various sections. The sections are organized into three general categories:
-
Statistical Analysis
-
Recent SQL vs. Unique SQL
-
Address Space Analysis
You access reports by using the controls at the top of the page to perform the following tasks, and then clicking Generate to generate the report. A PDF button is also provided for generating the report in PDF format.
-
Date/Time allows you to filter displayed data by date and time.
-
Filter allows you to specify a variety of filter parameters.
-
Generate generates the report using the specified date range and active filter.
-
PDF displays the report in a new browser tab. You can print the page or save it as a PDF file.
After you click Generate, you can use your mouse to scroll through the report or click the section names at the left side of the page to view specific report sections. The bottom-right area of each report has controls such as Activity, Unique SQL, and Most Connected for sorting the information in the report.
The following sections describe the analytic reports.
Statistical Analysis Reports
The Statistical Analysis section of the Analytics Report page provides an overview of database network statistics. A number of key security indicators available here can help identify potential security weaknesses.
Included is a characterization of the total number of interactions between a database instance (a specific service name appearing on a specific database server IP/Port) and a client IP. This provides insight into the size of the security domain that must be managed. (Risk increases as domain size increases.) The total number of database instances reflects how many discrete points within the database network may represent potential information leaks. In well-controlled environments each database instance should have a security profile that describes the ownership, information class, and security attributes associated with it. In some cases, database instances can be skewed by large numbers of default service names (e.g., “master”) or farms of servers using the same service name, which may indicate a narrower variation in security profiles.
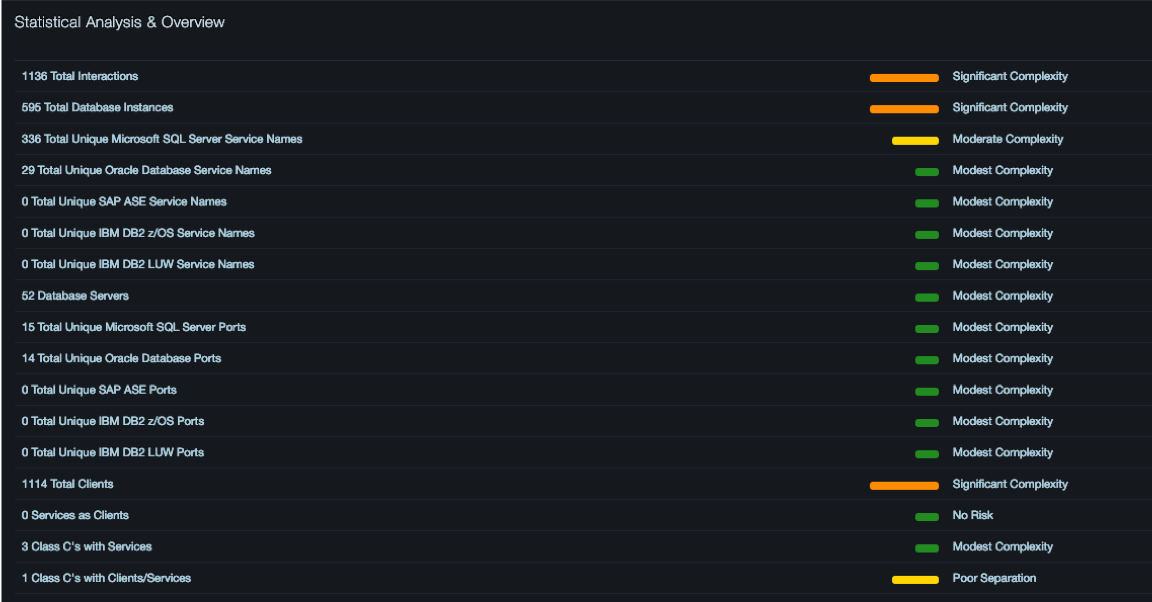
The Unique SQL and Oracle service name counts provide insight into how many different service names were found, which provides a stronger indicator of the range of functionality within the database environment. Note that this number reflects unique service names without regard to capitalization, so poor application coding practices do not skew the results. The larger the range of functionality, the greater the risk. At a minimum, each different. service name should have a security profile that should include the database servers on which it can be deployed.
The total number of clients and servers provides insight into how many servers need to be secured and how many clients are accessing the servers. As with other statistics, the larger these numbers the more challenging the security environment. In particular, because the clients here refer to the total number of directly attached (not web attached) clients, as this number grows, the risks associated with insider threat increase.
The number of unique MS-SQL and Oracle ports in use can provide insight into the risk of rogue databases in your environment. In many organizations this number should be small (two to four). If it is greater than this, it should be reviewed. If there is no policy of using specific ports for specific purposes, or ports are not being used as part of a named pipes structure then large port numbers could indicate attempts to hide databases from port scans that might locate them.
The number of servers acting as clients represents normal operation when a server accesses other servers to complete a request that includes external data. If this is not part of your normal operations it could indicate a server that has been compromised and is issuing queries to other servers to exfiltrate data
The total number of clients and servers provides insight into how many servers need to be secured and how many clients are accessing the servers. As with other statistics, the larger these numbers the more challenging the security environment. In particular, since the clients here refer to the total number of directly attached clients (not web attached), as this number grows the risks associated with insider threat increase.
The number of unique MS-SQL and Oracle ports in use can provide insight into the risk of rogue databases in your environment. In many organizations this number should be small (two to four). If it is greater than this, it should be reviewed. If there is no policy of using specific ports for specific purposes, or ports are not being used as part of a named pipes structure then large port numbers could indicate attempts to hide databases from port scans that might locate them.
The number of servers acting as clients represents normal operation when a server accesses other servers to complete a request that includes external data. If this is not part of your normal operations it could indicate a server that has been compromised and is issuing queries to other servers to exfiltrate data.
Filter
Setting or modifying the filter in the Filter field can make large data sets easy to view and manage. Filters can be used individually, or you can combine filter conditions using the AND and OR keywords to create filters that are as broad or narrow as required. The following table lists conditions you may find useful.
Display Options
| This Condition… | Displays… |
|---|---|
| db_name = 'name' | All the services mapped to a particular database name. |
| db_type = 1 | Services that are of type Oracle. |
| db_type != 2 | Services that are not of type SqlServer. |
| cli_cnt > 5 | Services that have had more than 5 distinct client IP connections. |
| svc_ip IN ('addr1','addr2',...) | Services that have the specified IP addresses. |
| svc_ip <<= INET '10.10.0.0/16' | Services that are in the 10.10.0.0/16 subnet. |
| NOT svc_ip <<= INET '10.10.0.0/16' | Services that are not in the 10.10.0.0/16 subnet. |
| svc_ip >= INET '10.10.0.0' AND svc_ip < INET '10.10.0.255' | Services in the IP range 10.10.0.0 - 10.10.0.254. |
| db_name ~ '*order*' | Services that have 'order' in its database name (case-sensitive regular expression). |
| db_name ~* '*Order*' | Services that have 'Order' in its database name (case-insensitive regular expression). |
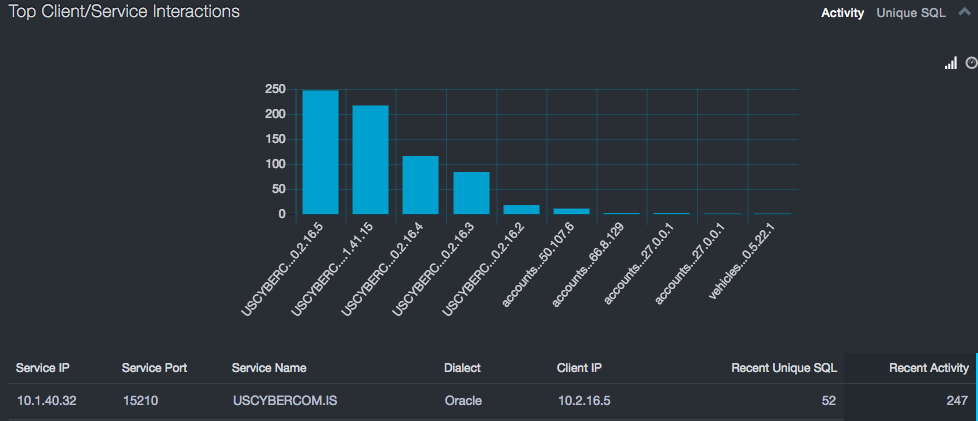
Top Client/Server Interactions Report
The Top Client/Server Interactions report shows the top 10 interactions by SQL executions (Activity) and by Unique SQL.
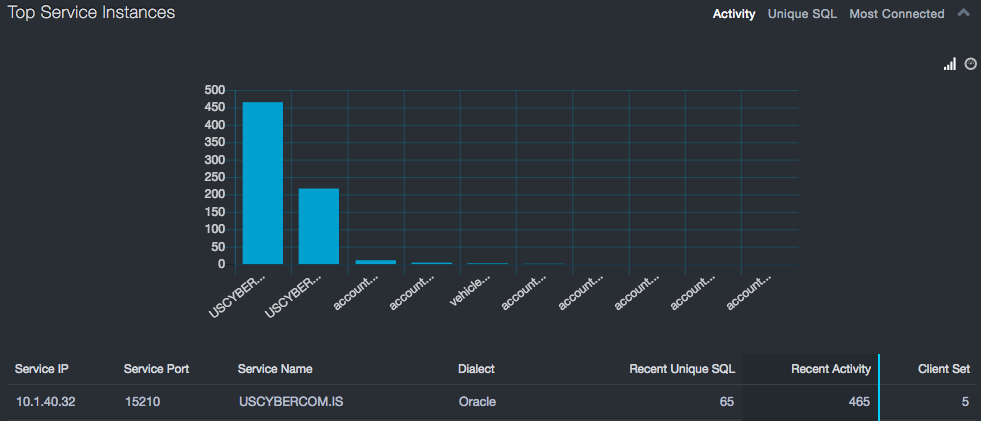
Top Service Instances Report
Top Service Instances refers to unique service names that are exhibiting the most executions, the most unique SQL statements, or are communicating with the largest number of clients. As with interactions, large numbers of executions or large variations in the SQL statements are typically associated with application servers, report generators, or tools. If services are not associated with that type of functionality, there could be a security risk.
When it comes to most connected, the situation is different. Here the risk is about the surface area of the security zone within which each service instance operates. If data within a service instance is highly sensitive, minimize the number of directly connected clients. Front-ending these databases with applications that limit access can reduce risk.
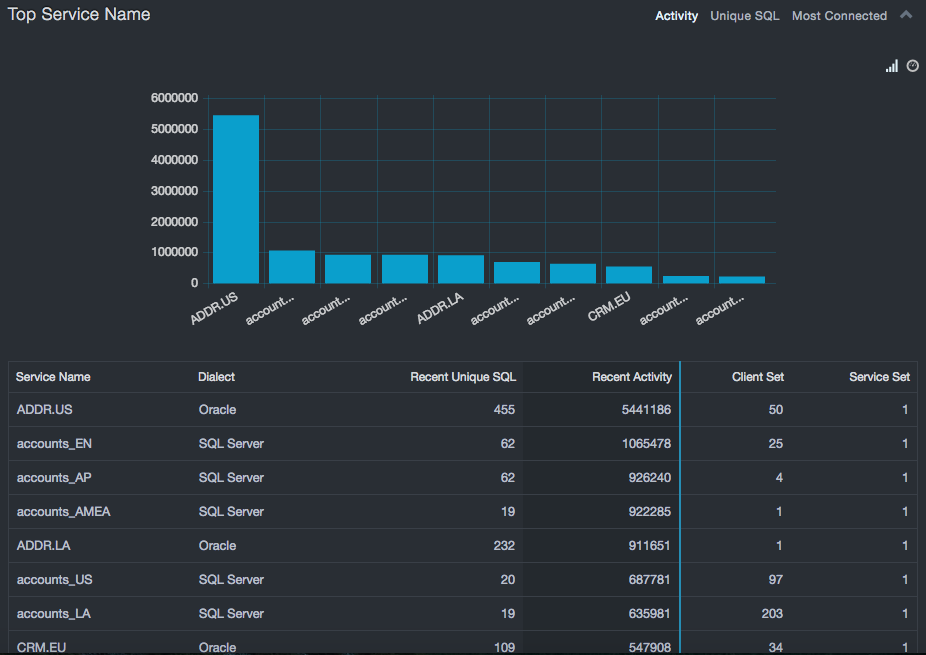
Top Service Name Report
Similar to the Top Service Instances, the Top Service Name report provides statistics based on the client interactions with a particular service name. In this case, all similar service names, ignoring capitalization, are combined across all the servers and ports. This gives a more accurate view when a service is split between multiple servers to balance load. It can also help identify instances of development or DBAs using the same service name. In these cases, the client count will increase. It is important to allow security personnel to ensure that the data being used on these development servers do not violate any security policies.
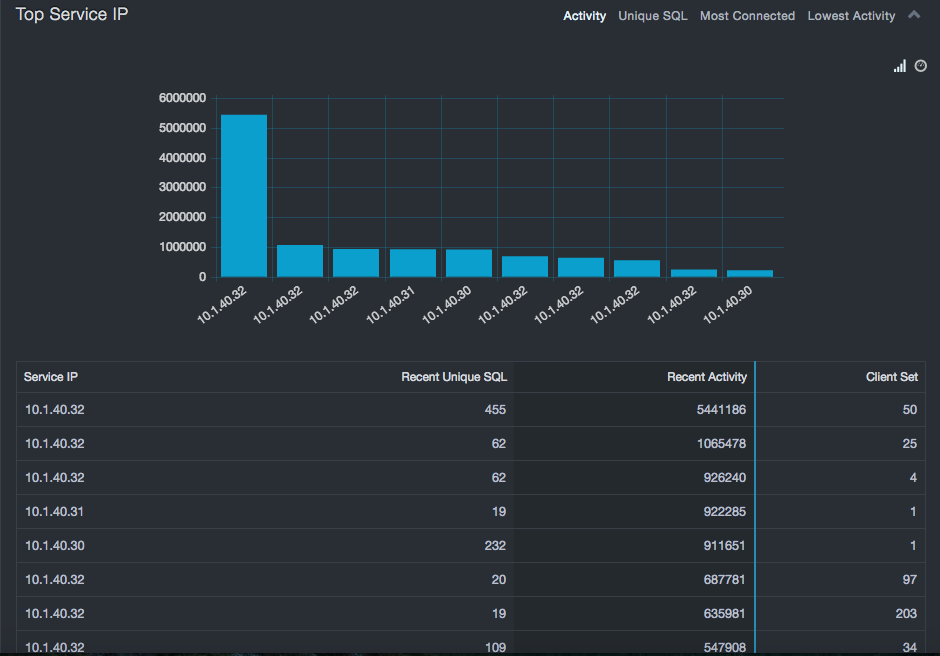
Top Service IP Report
The Top Service IP report focuses on database server statistics. These are useful in determining whether there are servers in less secure portions of the network that are generating high volumes of activity or large variations in SQL statements. This can indicate a server that is under attack or, at the least, a server whose usage model should be better understood.
In addition to security related aspects, these statistics can show risks of overload on servers by pointing to the most heavily loaded devices. Addressing these possible overload conditions can help avoid system outages or sub-optimal performance in the future. The Top Service IP table shows the least loaded database servers, which could provide guidance in consolidating or redistributing databases to reduce licensing costs or improve performance.
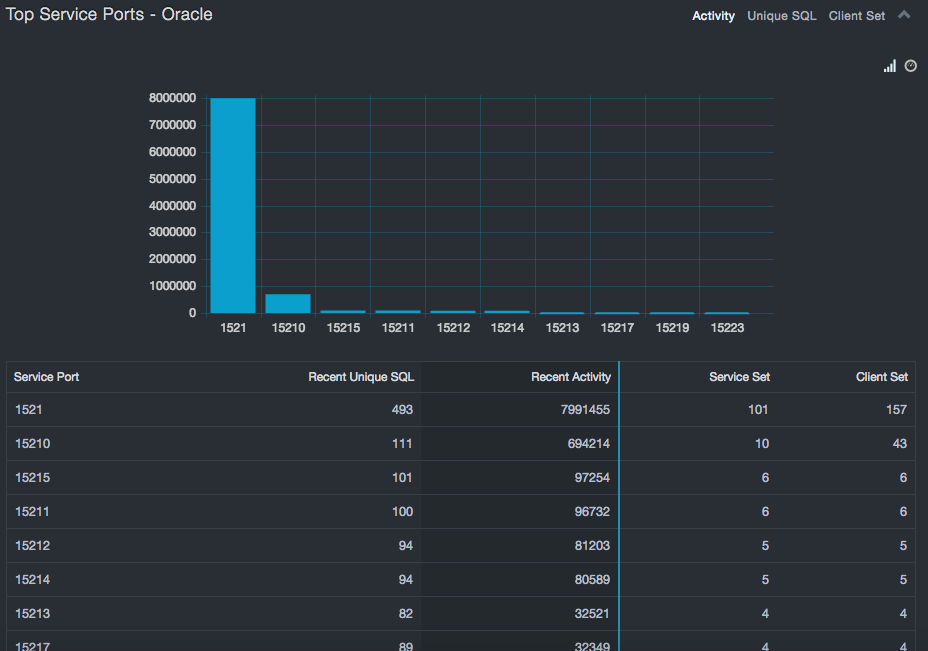
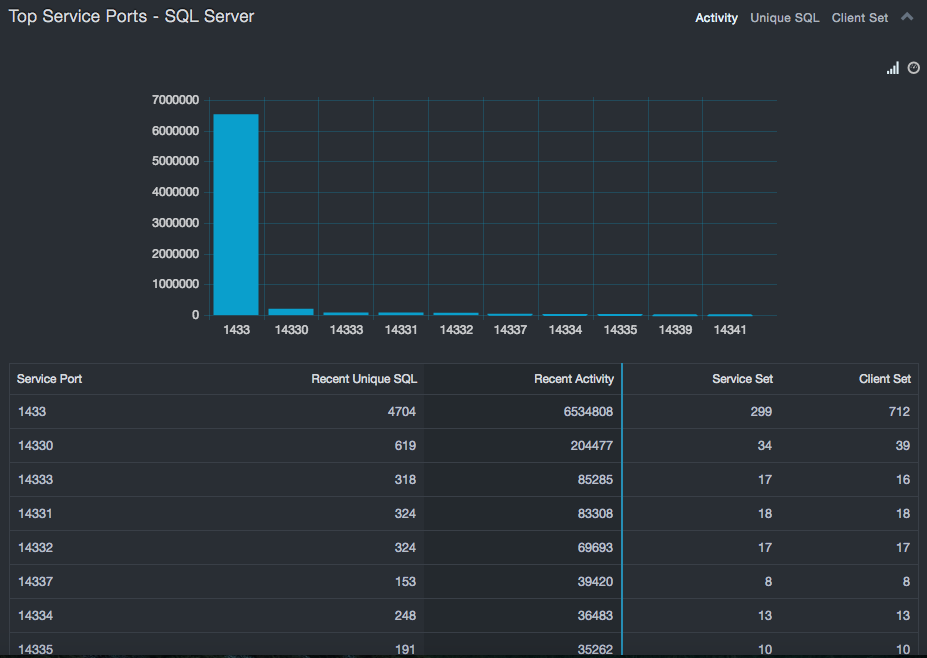
Top Service Ports – SQL Server, Oracle, Sybase, Db2 Mainframe, Db2 LUW
If more than a few ports are used for databases, those outside the default/normal port numbers should be investigated. In some cases, this merely relates to internal policy that uses specific ports for specific purposes. Alternatively, using MS SQL-named ports also results in atypical ports. However, if these two situations don’t apply, using alternate ports could indicate an attempt to hide a database from port scanners, which typically scan only the well-known ports. The Top Service Ports tables (Oracle and Sybase) provide insight into these aspects.
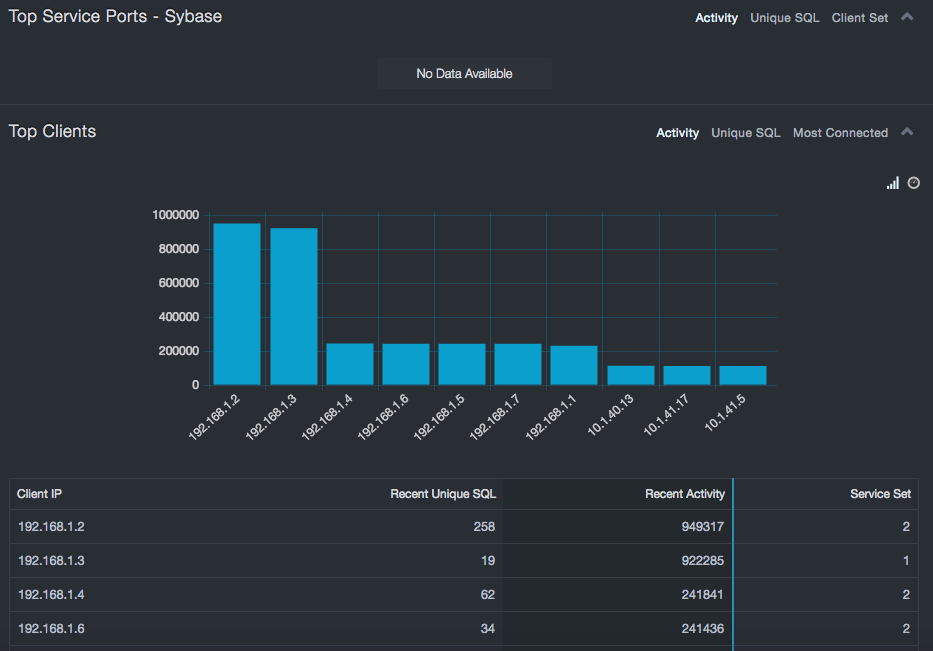
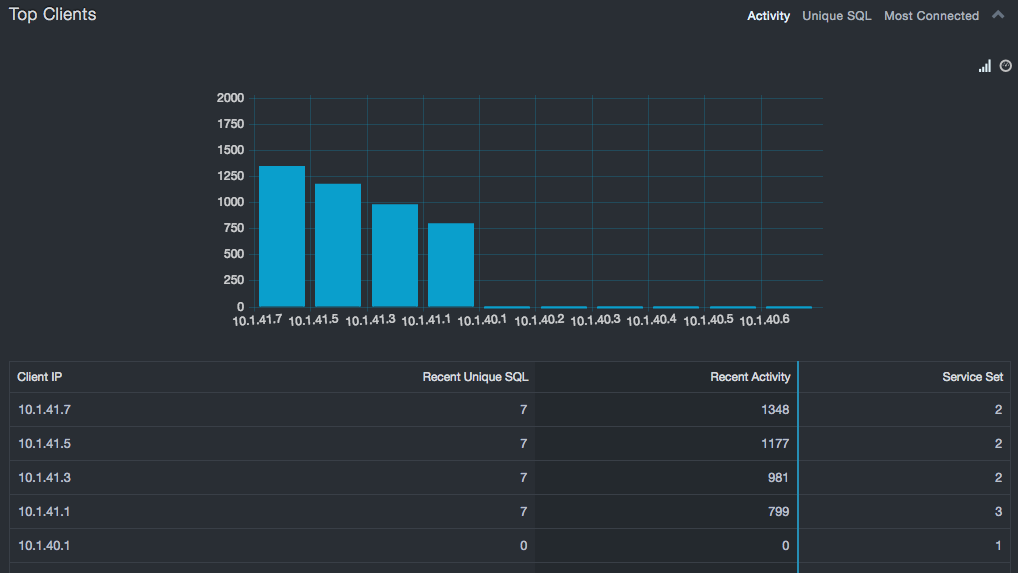
Top Clients Reports
The Top Clients report provides insight into which clients are busiest. In the case of activity and unique SQL, these clients should be application servers, report servers, or tools. If not, this is a security issue that should be investigated. In the case of “most connected,” these clients should be either tools or a very small set of top level DBAs to ensure that the least access is being enforced. Even in the case of tools, some care should be taken to ensure that the tools are accessing only those systems required to perform their functions.
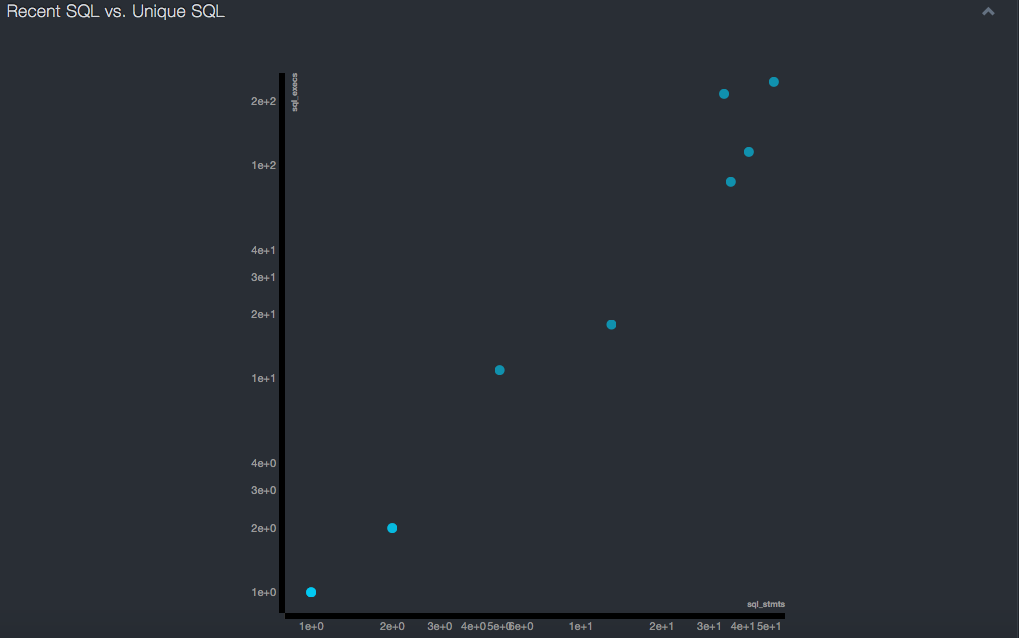
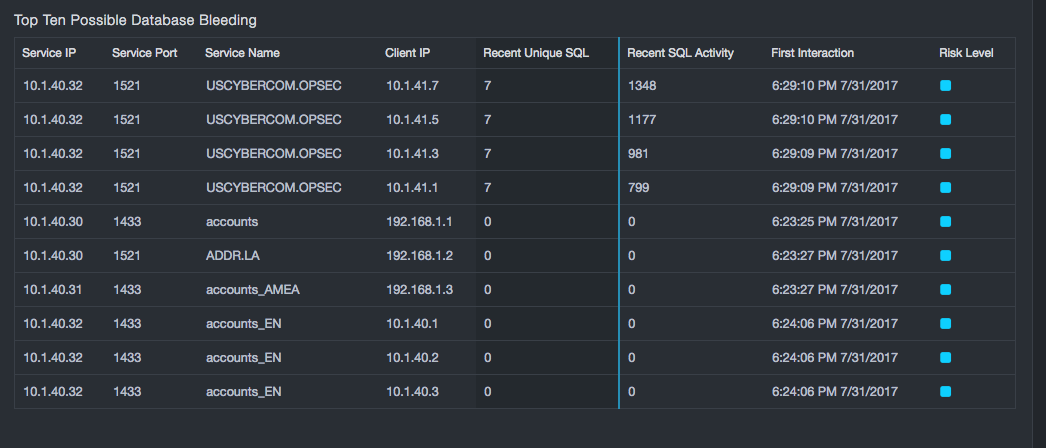
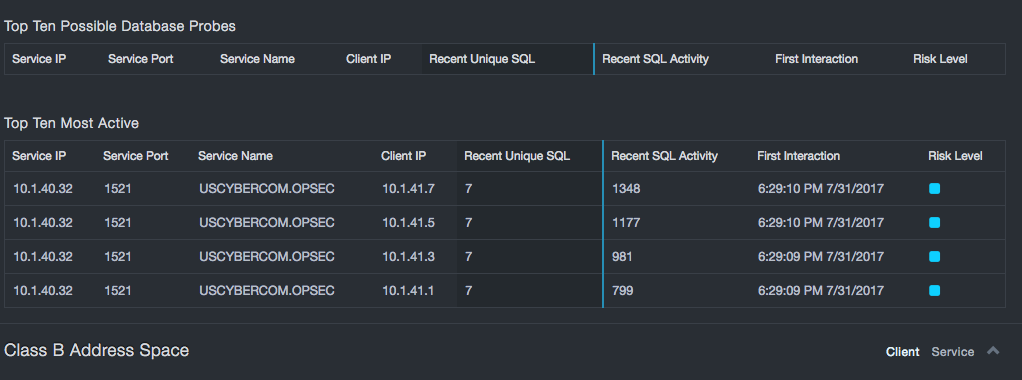
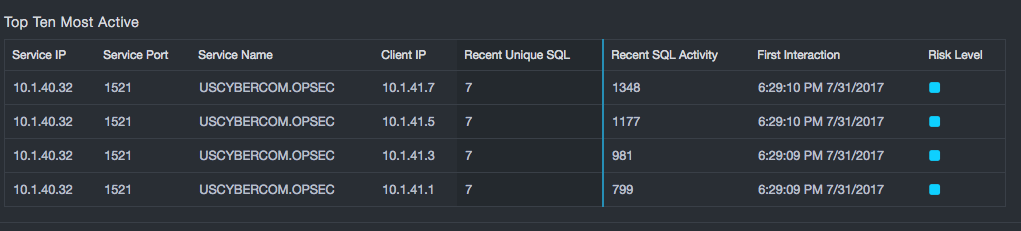
Recent SQL vs. Unique SQL Reports
Comparing Recent SQL Activity to Recent Unique SQL reports provides insight into a database network. Three areas should be considered:
-
The first is the area along the left axis. Here clients execute a small number of statements a large number of times. This can indicate an attack that is bleeding a database.
-
The second is the area where the number of statements being executed is similar to the number of unique statements seen. As this goes beyond 10-20 statements, it is generally inconsistent with either application or DBA usage patterns and can indicate a probe.
-
The final area is the top-right area, which has high usage and a diverse statement set. If these clients are not application servers, report generators, or tools, this behavior should be investigated.
In addition to raw numbers, consider how recently the client started talking to the database. This is indicated by color, with red dots representing more recently started conversations. A client that just started communicating with a database and shows the unusual behaviors described above should be given priority in any investigation.
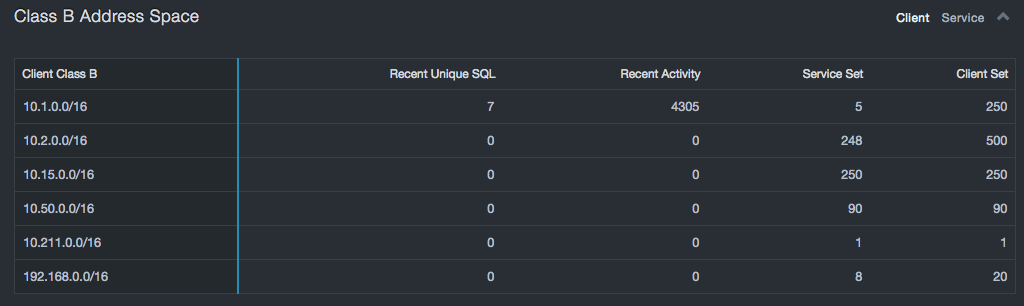
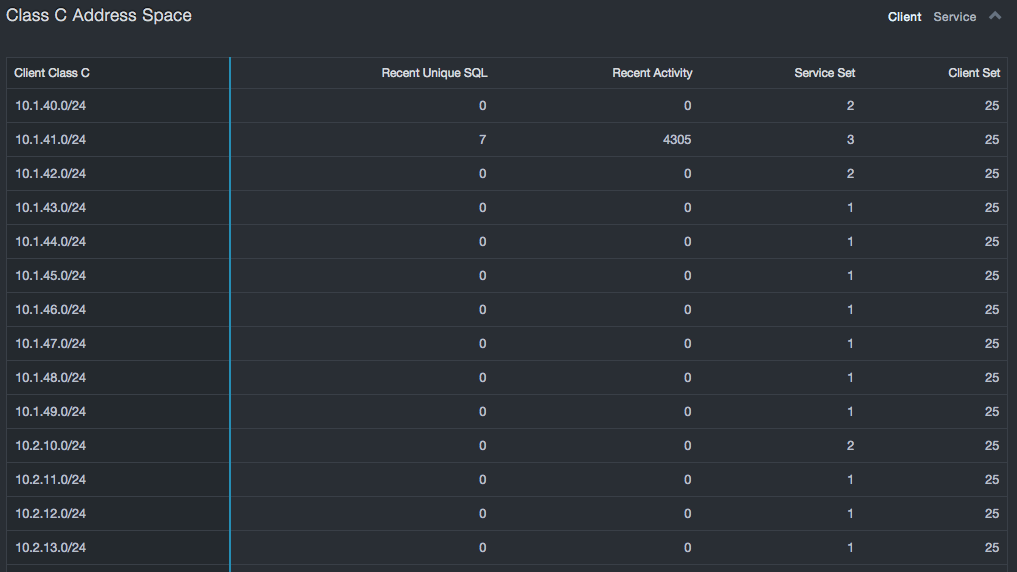
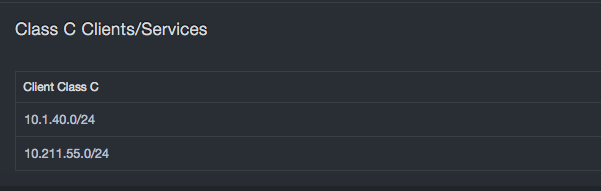
Address Space Analysis Reports
Most organizations use network partitioning to control access to systems. The number of Class C address spaces that database servers occupy indicates the size of the security boundary that must be protected. The risk grows in proportion to the number of servers being protected and in relation to the growing number of subnets it spreads across — especially as the ratio of servers per subnet decreases, which can happen if databases are added without concern for network-based security. The number of subnets containing clients and servers indicates the risk associated with separation of duties and may indicate attempts to hide databases from port scans.
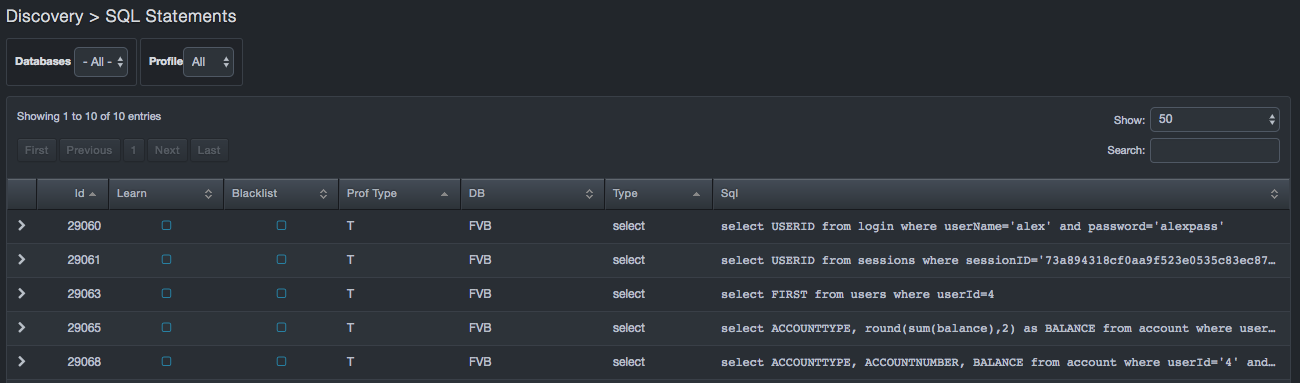
SQL Statements
Path: Visibility > SQL Statements
The SQL Statements page lists the SQL statements that DBC platform has observed between the client and the database service. Drop-down lists at the top-left side of the workspace allow you to select the database and the profile you want to view.
Columns in the SQL Statements Page
| Column | Description |
|---|---|
| Id | Internal identifier DBC platform uses to identify statements. |
| Learn | Shows learned statements. Hover over the column header to display the following legend for the values in this column. |
| Blacklist | Shows blacklisted statements. Hover over the column header to display the following legend for the values in this column. |
| Prof Type | Shows statements added from the Events screen (see section 6.4). Hover over the column header to display the following legend for the values in this column. |
| DB | Database on which the statement was seen. |
| Type | Type of SQL statement (for example, select, insert, update, drop, and so on). |
| Sql | Actual SQL statement. |
Contact Technical Support
For any technical difficulties you may experience, you can contact DB CyberTech Technical Support at the following:
Email: support@dbcybertech.com
Phone: 1(800) 375-0592
Glossary
| Term | Definition |
|---|---|
| API | Application Programming Interface. A set of routines, protocols, and tools for building software applications. |
| Blacklisted statements | Statements that are not added to the learned set. Typically, these statements are used to filter out benign statements generated by DBAs or other non-application related interactions |
| BPF | Berkeley Packet Filter. An architecture for user-level packet capture. BPF provides a raw interface to data link layers in a protocol-independent fashion. |
| CAC | A "smart" card about the size of a credit card used as identification for active duty uniformed service personnel, Selected Reserve, DoD civilian employees, and eligible contractor personnel. |
| CSV | Comma-separated value. Data format where each piece of data is separated by a comma. |
| DHCP | Dynamic Host Protocol Configuration. A standardized network protocol used on Internet Protocol networks to dynamically distribute network configuration parameters, such as IP addresses, for interfaces and services. With DHCP, computing devices like your DBC platform request IP addresses and networking parameters automatically from a DHCP server, reducing the need to configure these settings manually. |
| DNS | Domain Name System. A hierarchical decentralized naming system for computers, services, or any resource connected to the Internet or a private network. DNS translates domain names into the numerical IP addresses to locate and identify computer services and devices with the underlying network protocols. |
| LDAP | Lightweight Directory Access Protocol. A protocol for accessing a directory listing in a TCP/IP network. It is a sibling protocol to HTTP and FTP and uses the ldap:// prefix in its URL. |
| Learned set | Contains statements considered to be part of the application’s normal behavior. |
| MAC | Media Access Control. A hardware address that uniquely identifies each node of a network. |
| MTU | Maximum Transmission Unit. The largest physical packet size measured in bytes that a network can transmit. Any messages larger than the MTU are divided into smaller packets before being sent. |
| Network File System | A client/server application that allows network users to access shared files stored on computers of different types using a Virtual File System that runs on top of TCP/IP. |
| NTP | Network Time Protocol. A networking protocol for clock synchronization between computer systems over packet-switched, variable-latency data networks. |
| pcap | Short for packet capture. A program for capturing network traffic. |
| Server Message Block | A message format used by Windows to share files, directories, and devices. |
| SSL | Secure Sockets Layer. A protocol for transmitting private documents via the Internet. SSL uses a cryptographic system that uses two keys to encrypt data. |

DB CyberTech
15015 Avenue of Science
Suite 150
San Diego, CA 92128
http://www.dbcybertech.com