Security
Introduction
The DBC Platform uses a graphical user interface web management interface for all components available to the user. This reference guide describes the menus and options in the DBC Platform web management interface related to the Security product.
Organization of the Manual
This manual contains the following sections and appendix:
- Security Menu
This section covers the Security menu. It describes the Security Dashboard, User Behavioral Analytics, Data Flow Explorer, Policy Events, Behavioral Incidents, Rule Management, and Settings.
- Reporting Menu
This chapter covers the Reporting menu. It describes how to work with the custom reports section of the system.
- APPENDIX A - Glossary
This appendix defines the technical terms in this manual. In this guide, the first time a technical term is used, it appears as a hyperlink. If you click the link in the electronic document, you are taken to the definition for that term in the glossary. Clicking the term in the glossary returns you to the first instance of that term in the electronic document.
Security Menu
| This chapter describes the options in the Security menu. |
Overview
Insider threat against database management systems is a dangerous security problem. Unauthorized users can abuse legitimate privileges to masquerade as other users or to harvest data maliciously. Ensuring the security and privacy of data assets is critically important.
The Security feature is designed to analyze SQL commands (or “statements”) exchanged between clients and servers and identify abnormal patterns that can indicate a breach. You access this feature using the commands in the Security menu.
This feature provides a tool kit to identify potential and real threats:
-
The Dashboard characterizes the nature of stability in your system and summarizes the events that the system has generated based on any rules that are in place.
-
User Behavior Analytics provides reporting information on the operation of database clients and services at the operation and table level, including details on behavioral incidents.
-
Data Flow Explorer summarizes and analyzes data flows in a client environment. It also allows you to create rules.
-
Policy events allow you to view all potential threat events that would be triggered with the current rules in place as well as view events triggered by the DBC Platform’s Insider Threat feature.
-
Behavioral Incidents shows behavioral incidents that the DBC Platform appliance has detected.
-
Rule Management allows you to view, edit, delete, and commit rules, revert to the previous commit stage, and save and preview your changes.
-
Settings contains simple and advanced auto-protect settings.
Dashboard
Path: Security > Dashboard
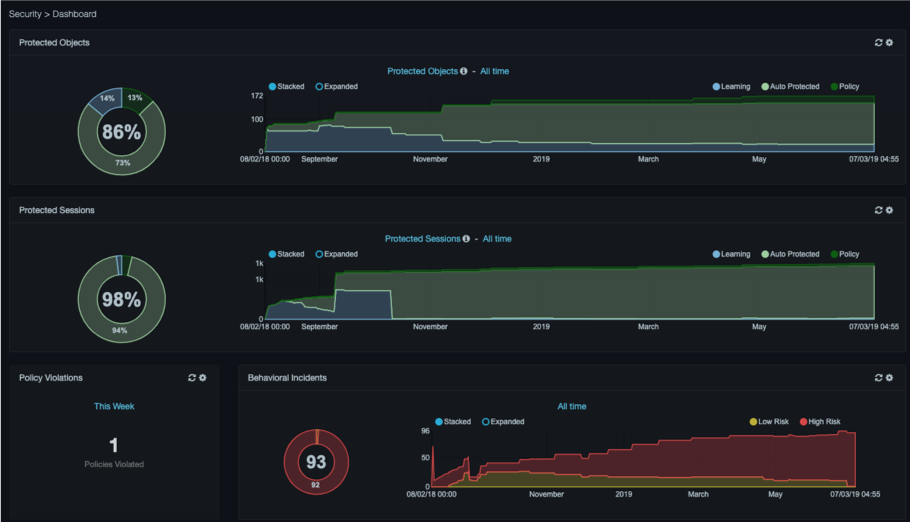
The dashboard characterizes the nature of stability in your system and summarizes the events that the system has generated based on any rules that are in place. Rules tell the DBC platform to perform an action, such as generating an event, if it detects activity that meets the rule criteria. The Rule Management section provides detailed information on this functionality.
Protected Dashlets
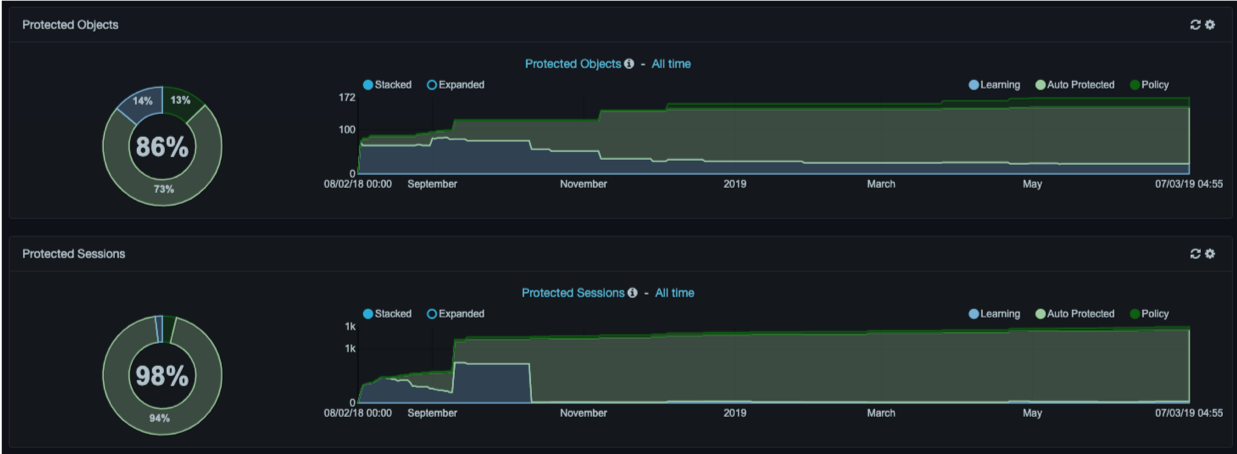
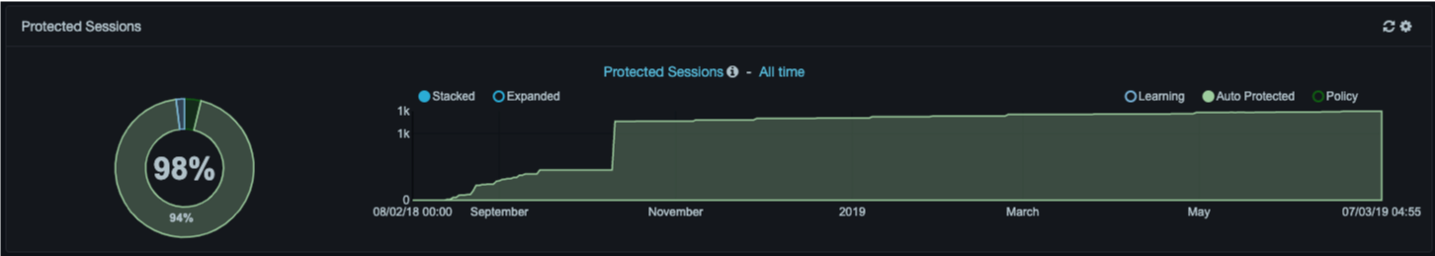
Protected dashlets show the percentage of the network, by clients, services, sessions, or database objects that is “protected” compared to the percentage that is “unprotected.” Protection can be in the form of a policy rule or automated behavioral learning.
Radio buttons above each graph allow you to select one of four categories for viewing:
-
Ignored = part of the system that is explicitly excluded from behavioral modeling and policy events according to user specified criteria.
-
Learning = auto pilot has yet to observe sufficient stability for this part of the system so that its behavior can be automatically protected.
-
Policy = part of the system that is explicitly excluded from behavioral modeling, but will trigger an event if activity is observed matching user-specified criteria.
-
Auto Protected = auto pilot has observed sufficient stability in this part of the system that it can be protected automatically and will raise behavioral incidents if that stability is violated.

Both the current values for the selected metric and historical trend are shown. Stacked and Expanded radio buttons above each graph allow you to view abbreviated or detailed information. Both graphs auto-refresh every 5 minutes, although you can disable auto- refresh. A manual refresh icon appears to the left of the gear icon at the top-right side of the dashlets.
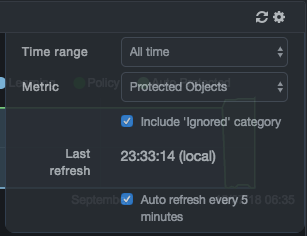
Changing Graph Time Frames
By default, the dashboard graphs are configured to show activity for this week. You can change this time frame to suit your requirements. For example, if the Insider Risk Analysis identifies suspicious activity, you might want to shorten the time frame until the issue is addressed. This procedure also allows you to disable auto-refresh for a graph.
-
To change graph time frames
-
Click Security > Dashboard. The Dashboard appears.
-
At the top-right side of a graph, click the
 icon (or click either blue link above a
graph). The following dialog box appears.
icon (or click either blue link above a
graph). The following dialog box appears.
- Complete the fields, and then click the
 icon again.
| Field | Description |
|---|---|
| Time range | Time span to be monitored and displayed on the graph. |
| Metric | Select whether you want to monitor protected clients, protected services, protected objects, or protected sessions. |
| Include ‘Ignored’ category | Determines whether the graph shows or ignores the Ignored category.
|
| Last refresh | Read-only field that shows the local time when the graph information was updated. |
| Auto refresh every 5 minutes | Determines whether DBC Platform updates the graph information every five minutes.
|
Viewing Graph Details
There are two ways to view graph details:
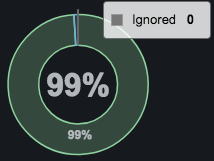
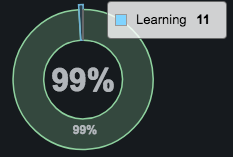
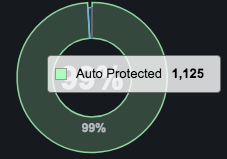
- Hovering over a graph shows percentages of all the categories, along with a total of the percentages. For example:
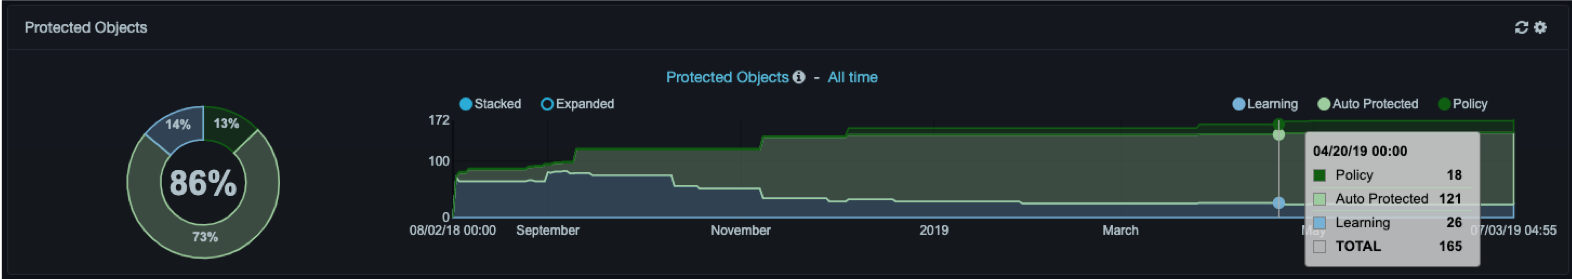
- Clicking an element in a graph displays a popup similar to the following for the category being monitored.
Pie Charts
 Pie charts to the left of each protected graph show the percentage of
learning undertaken by DBC Platform. Clicking a slice of the pie chart
takes you to the Data Flow Explorer. If you click on a
policy, ignored, or protected slice, you will be linked to the
corresponding selection in the Data Flow Explorer.
Pie charts to the left of each protected graph show the percentage of
learning undertaken by DBC Platform. Clicking a slice of the pie chart
takes you to the Data Flow Explorer. If you click on a
policy, ignored, or protected slice, you will be linked to the
corresponding selection in the Data Flow Explorer.
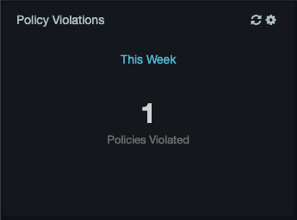
Policy Violations
The Policy Violations area shows the number of new policy rules triggered during the selected time range. Use the gear icon or the link above the number to change the time range and to enable or disable auto-refresh. A manual refresh icon appears to the left of the gear icon.
Clicking the number takes you to the Events tab on the Insider Threat > Policy Events page.
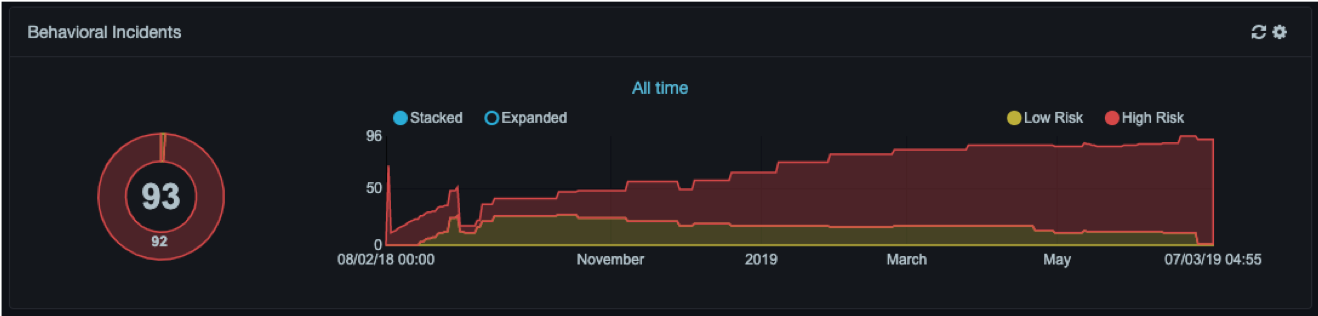
Behavioral Incidents
The Behavioral Incidents area shows the number of existing incidents and a historical trend of the incidents detected by the Aspecto system. Incidents are distinguished by low and high risk. High risk incidents are communicated externally via syslog. In contrast, low risk incidents are reconsidered by the Auto Pilot over time. Use the gear icon or the link at the top-center to change the time range and to enable or disable auto-refresh. A manual refresh icon appears to the left of the gear icon.
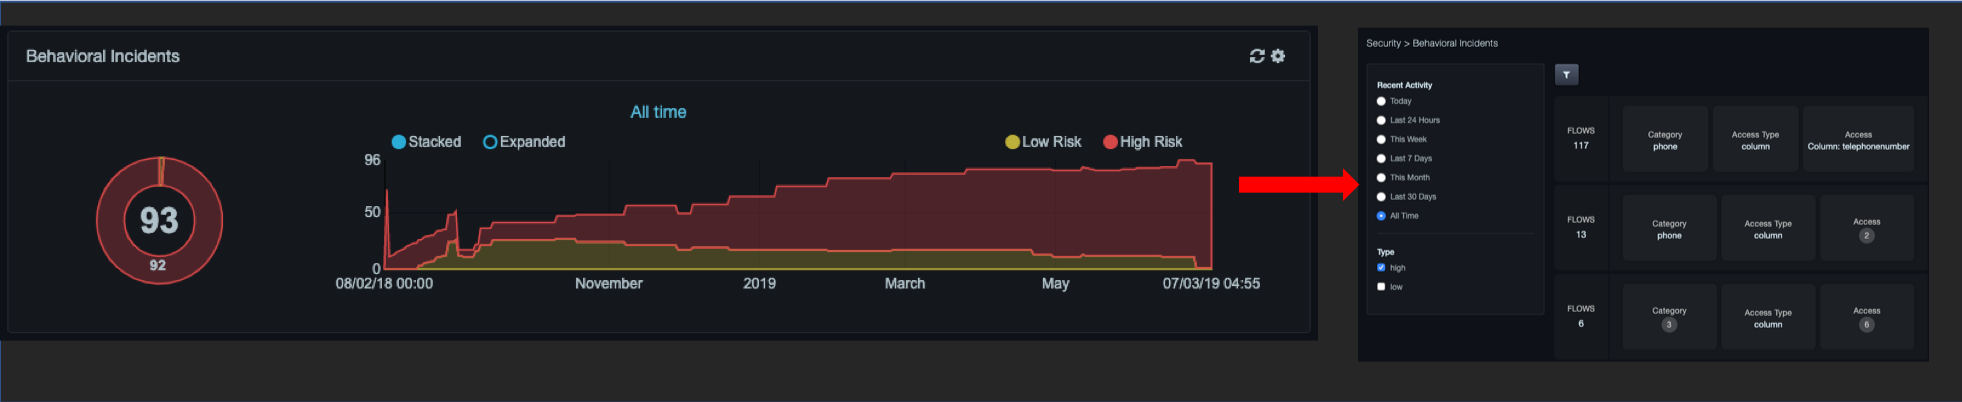
Clicking a slice in the chart takes you to the Behavioral Incidents page, with the corresponding risk level pre-selected in the filter pane. If you click the center text of the pie chart, the same page appears, but with all risk levels selected. For example:
User Behavior Analytics
Path: Security > User Behavior Analytics
The User Behavior Analytics dashboard is similar to the discovery interconnection dashboard, providing insider threat analytical data:
The page provides the following reporting sections:
-
Overview
-
Newest and Busiest Relations
-
Shared Access
-
Sources of Unpredictable Behavior
-
Sources of Behavioral Events
-
PDF
-
Glossary
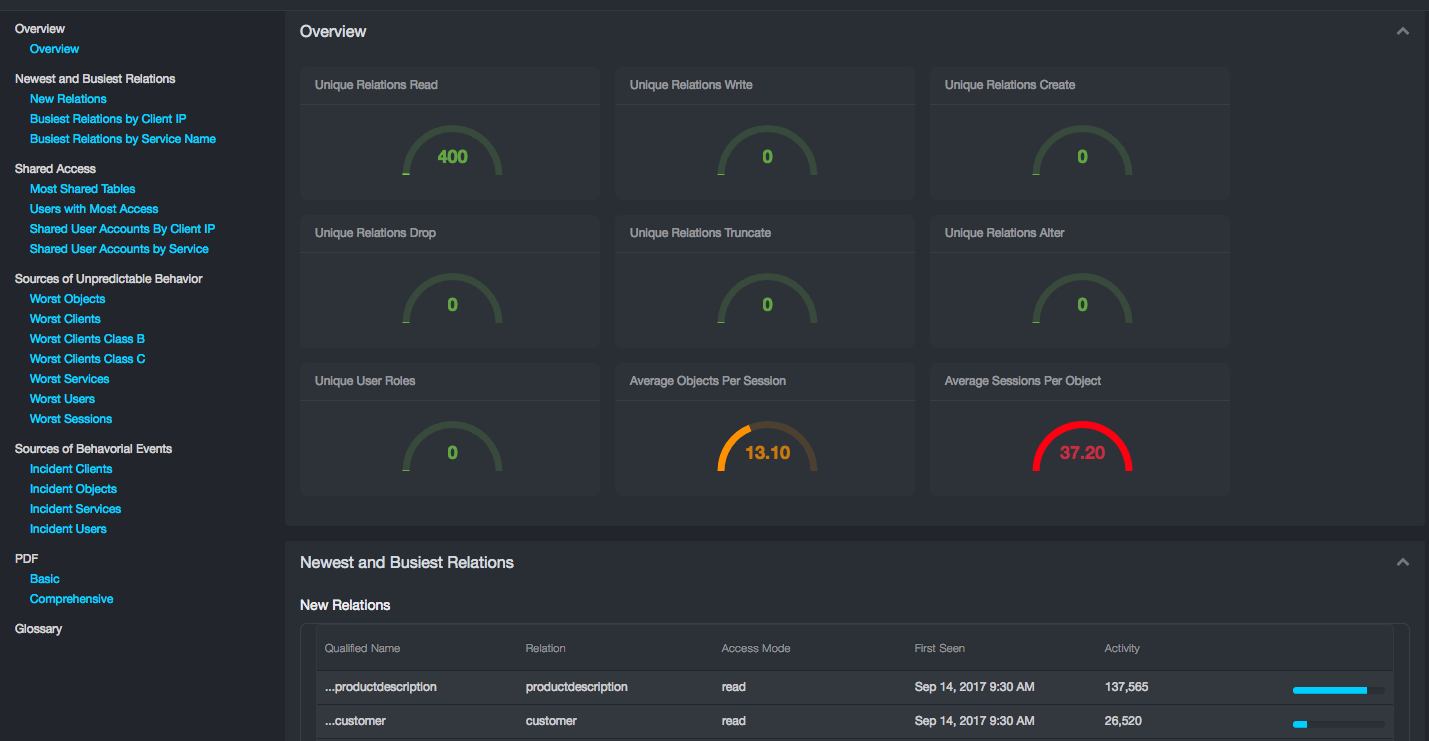
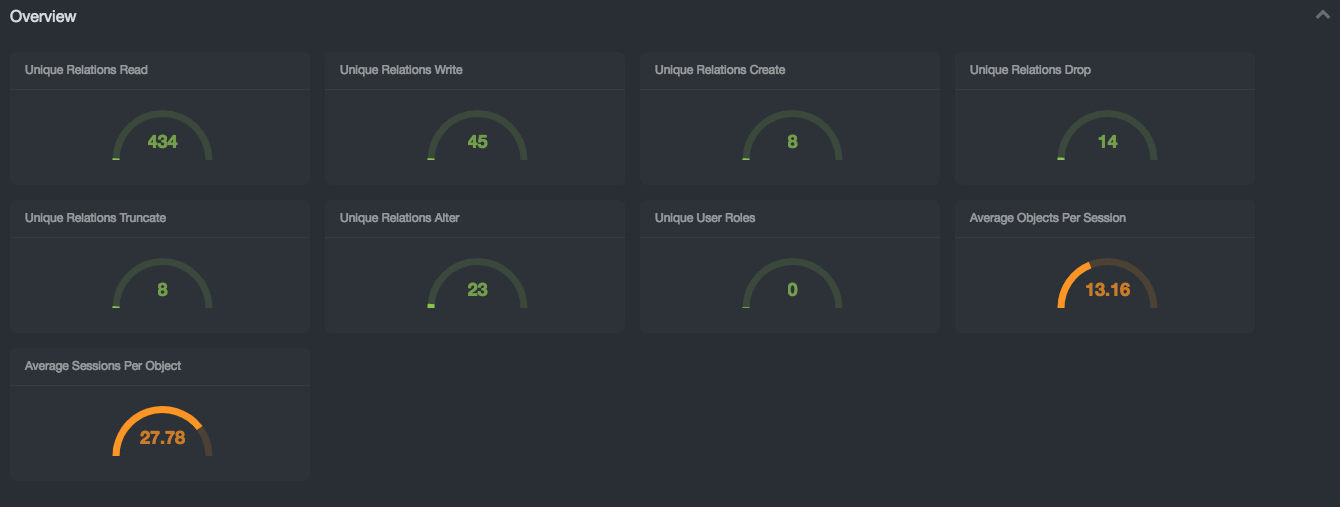
Overview
The Overview subsection conveys the table space complexity of the database networks under monitoring. The report contains a list of metrics and a grade of their complexity:
-
Unique Relations Read: Low/Medium/High: 1-10k / 10-50k / 50k+
-
Unique Relations Write: Low/Medium/High: 1-1k / 1-5k / 5k+
-
Unique Relations Create: Low/Medium/High: 1-100 / 100-1,000 / 1,000+
-
Unique Relations Drop: Low/Medium/High: 1-100 / 100-1,000 / 1,000+
-
Unique Relations Truncate: Low/Medium/High: 1-100 / 100-1,000 / 1,000+
-
Unique Relations Alter: Low/Medium/High: 1-100 / 100-1,000 / 1,000+
-
Unique User Roles: Low/Medium/High: 1-50 / 50-100 / 100+
-
Average Objects Per Session: Low/Medium/High: 1-10 / 10-35 / 35+
-
Average Sessions Per Object: Low/Medium/High: 1-10 / 10-35 / 35
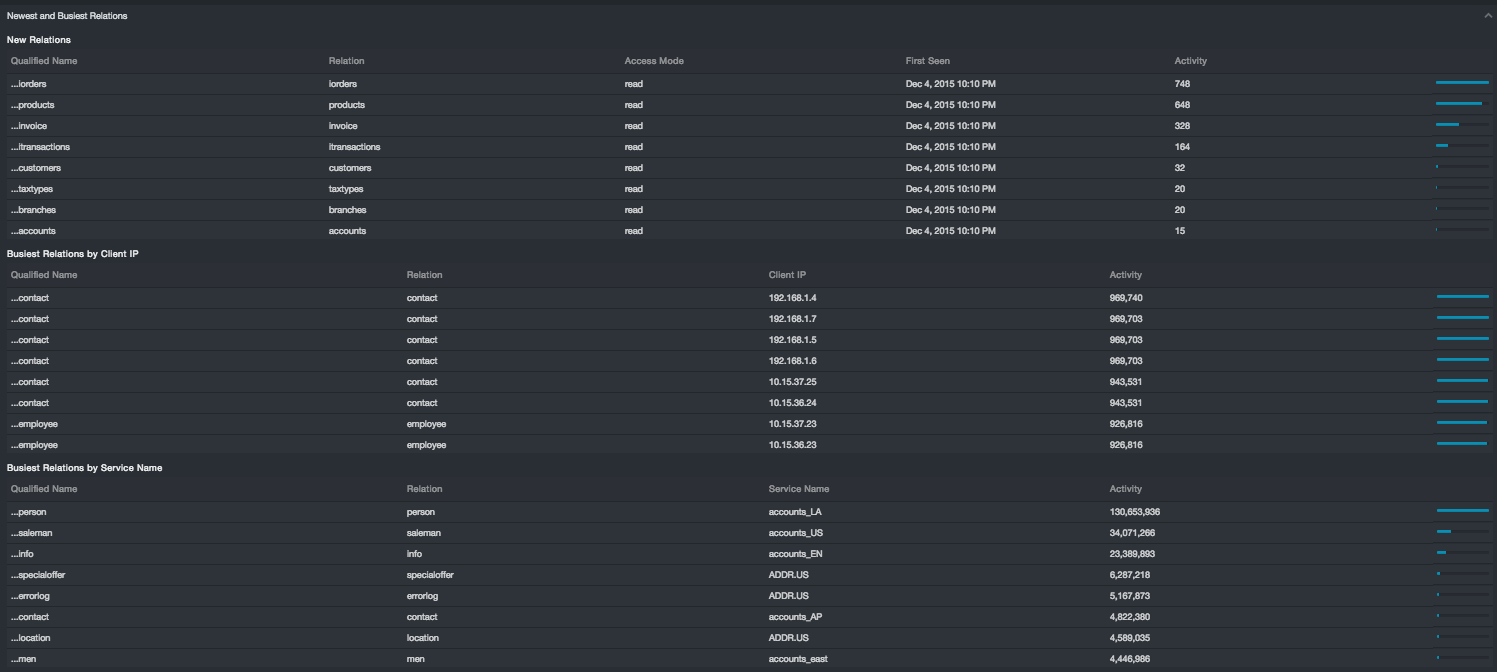
New and Busiest Relations
The Newest and Busiest Relations subsection provides three reports:
-
New Relations: Qualified Name, Relation, Access Mode, First Seen, Activity
-
Busiest Relations by Client IP: Qualified Name, Relation, Client IP, Activity
-
Busiest Relations by Service Name: Qualified Name, Relation, Service Name, Activity
New relations are indicative of how your database environment is evolving. Unfamiliar or unexpected tables are indicative of poor process control over provisioning of new database assets. Like relations in general, new relations accessed for write are less common than read, and new relations access for drop, create, alter, or truncate are even more uncommon. If these modes of access show up frequently under new relations, the table environment in your database network is potential very unstable.
Some relations in a database network are typically very busy. The busiest should be well correlated with your production applications and resources, such as clients and services. If this is not the case, e.g. a development resource or application is busier than your production environment, that discrepancy should be understood: Several risks such as a denial of service, an inadvertent load test, or a large scale data breach could be at play. While some of these scenarios might be benign, they can mask other risk behavior.
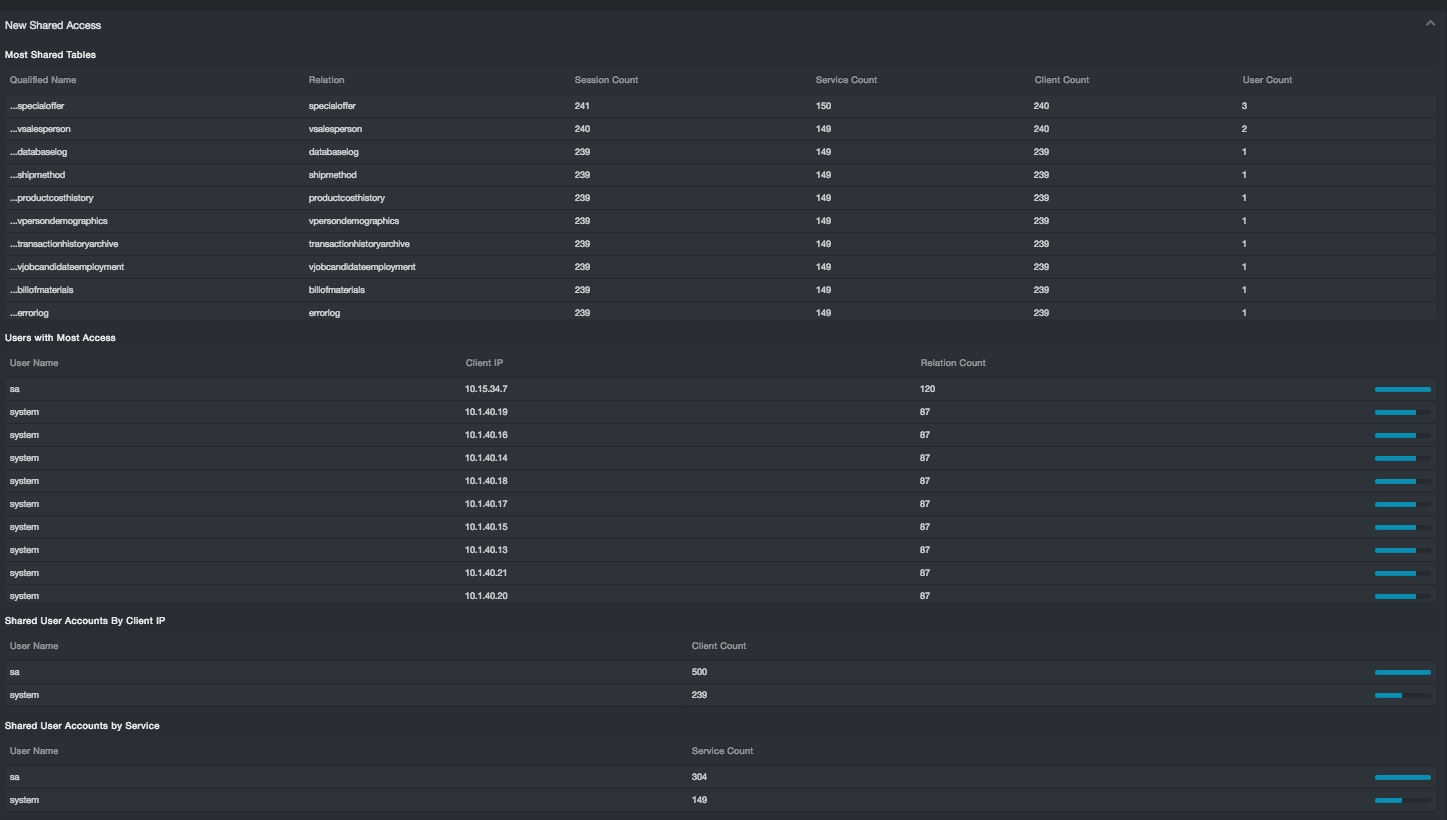
Shared Access
The Shared Access subsection contains four reports:
-
Most Shared Tables: Qualified Name, Relation, Session Count, Service Count, Client Count, User Count
-
Users with Most Access: User Name, Client IP, Relation Count
-
Shared User Accounts by Client IP: User Name, Client Count
-
Shared User Accounts by Service: User Name, Service Count
This section characterizes the risk associated with sharing access across clients, user names, and credentials. The subsections identify the top ten instances for each category.
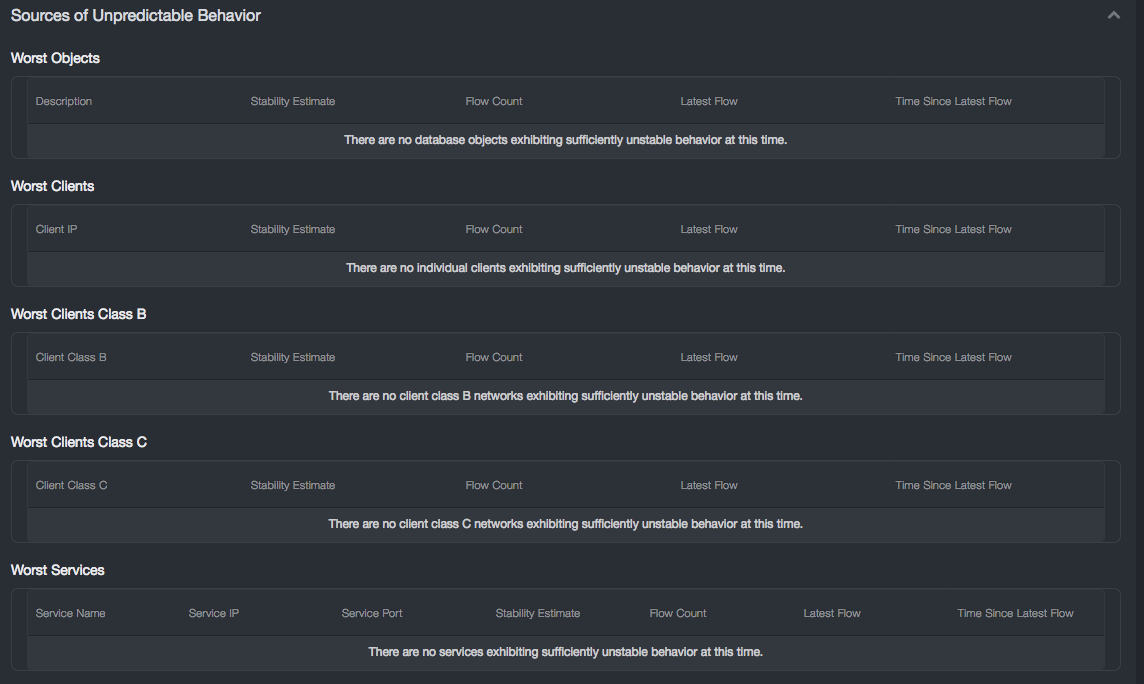
Sources of Unpredictable Behavior
The New Insider Risk Section contains seven reports:
-
Worst Objects: Description, Stability Estimate, Flow Count, Latest Flow, Time Since Latest Flow
-
Worst Clients: Client IP, Stability Estimate, Flow Count, Latest Flow Time Since Latest Flow
-
Worst Clients Class B: Client IP, Stability Estimate, Flow Count, Latest Flow Time Since Latest Flow
-
Worst Clients Class C: Client IP, Stability Estimate, Flow Count, Latest Flow Time Since Latest Flow
-
Worst Services: Client IP, Stability Estimate, Flow Count, Latest Flow Time Since Latest Flow
-
Worst Users: Client IP, Stability Estimate, Flow Count, Latest Flow Time Since Latest Flow
-
Worst Sessions: Client IP, Stability Estimate, Flow Count, Latest Flow Time Since Latest Flow
This section characterizes the risk of Insider Threat in two primary ways. One is to list those objects, clients, users, and services which are least stable. The other is to list those objects, clients, users, and services already implicated in a behavioral incident. The Worst Objects, Worst Clients, etc. reports tell you where your database network is least predicable. That is where Insider Threat can hide unnoticed, and where standard anomaly detection cannot establish a baseline with which to protect your assets.
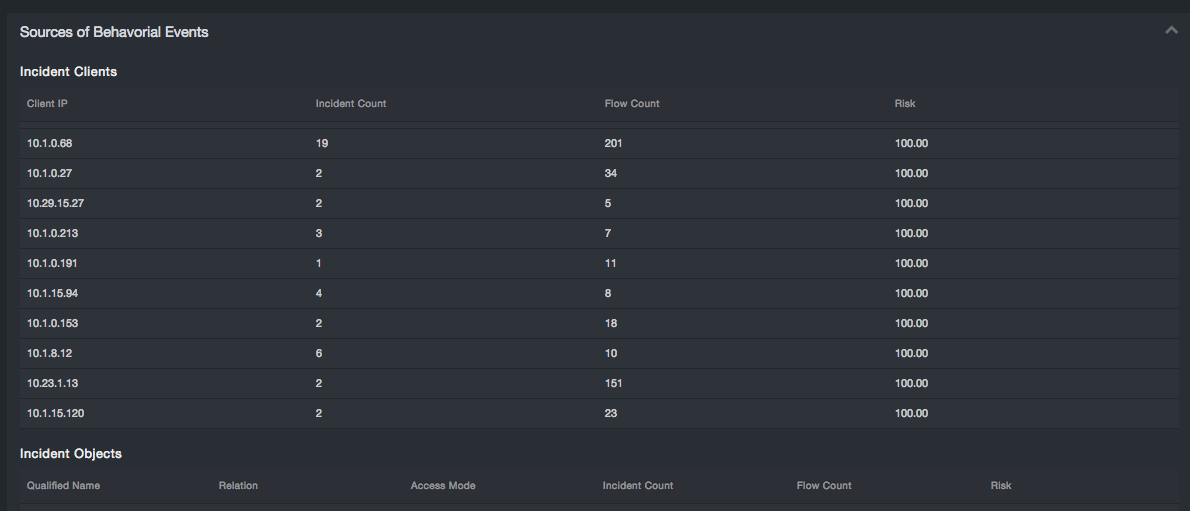
Sources of Behavioral Events
The Sources of Behavioral Events subsection contains four reports:
-
Incident Clients: Client IP, Incident Count, Flow Count, Risk
-
Incident Objects: Qualified Name, Relation, Access Mode, Incident Count, Flow Count, Risk
-
Incident Services: Service Name, Service IP, Service Port, Incident Count, Flow Count, Risk
-
Incident Users: User Name, Incident Count, Flow Count, Risk
This subsection complements the fuller featured Behavioral Incidents Page and Cluster Detail pages. This is a set of top ten results for objects, clients, users, and services involved in current incidents.
PDF
The full report can be generated into a PDF format for printing or offline review. The Basic option provides the reporting data only. The Comprehensive option includes detailed descriptions of each section.
Glossary
Clicking the Glossary button will display an on-screen listing and definition of key terms used in the reports.
Data Flow Explorer
Path: Security > Data Flow Explorer
The Data Flow Explorer summarizes, analyzes, and creates rules for monitoring data flows in a client environment. “Data flow” refers to the unique combination of a database object, its mode of use, and a session.
An object refers to an optionally qualified database object that the Aspecto observed in a SQL statement on the wire and the mode in which that object was being used. For example, the statement:
select name, address from SQL2008.HR.dbo.employees
contains a single object, SQL2008.HR.dbo.employees with the fully qualified relation "employees" accessed in a read mode. The qualifiers vary by SQL dialect, but can include server, database, and schema. In this example, these are SQL2008, HR, and dbo, respectively.
A session consists of the features of the network that describe where a SQL statement was observed. The session includes database user, client IP address, and service, where a service is specified by a service name, dialect, type, and listener IP address and port.
Interacting with the Data Flow Explorer
You interact with the Data Flow Explorer by drilling into features of a data flow.
The features into which you can drill down are:
-
Seven atomic features of an object: server, database, schema, table, mode, user/role type, and user/role name.
-
Seven atomic features of a session: client IP address, user, dialect, service type, service name, listener IP address, and listener port.
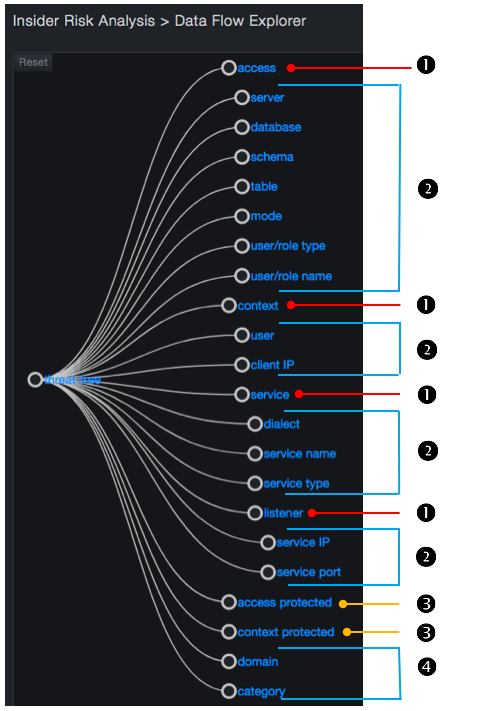
In addition, the Data Flow Explorer exposes the following features:
-
Rollups of atomic features: see ❶ and ❷
-
Aggregations across data flows: see ❸
-
Additional metadata associated with a data flow: see ❹
Data Flows and Rules
Every data flow is associated with a rule or handled by the Auto Pilot. By default, the system is shipped with no user- specified rules. As a result, the Auto Pilot handles all flows by default.
Each rule has a category associated with it. The category can be:
-
A system-defined monitor
-
A monitor with logging
-
An ignore
-
A user-defined category
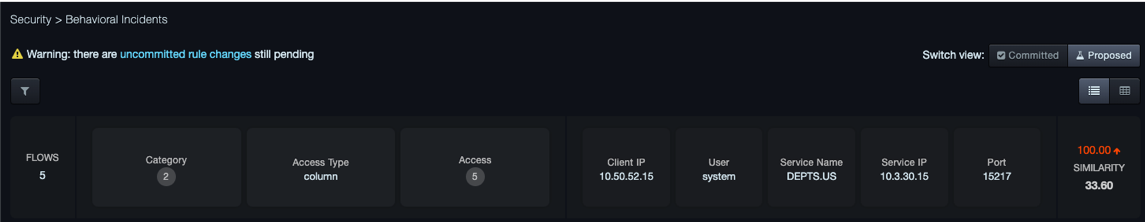
The Data Flow Explorer exposes the category for each data flow matching policy. If there are uncommitted rules under consideration, the Data Flow Explorer reflects the latest rule transaction (or set of rules), which might differ from the latest committed rule transaction; in addition, a warning appears in the following pages to remind you that there are uncommitted rule changes that are pending:
-
Security > Behavioral Incidents
-
Security > Dashboard
-
Security > Data Flow Explorer
-
Security > Rule Management
-
Security > Settings
Data Flow Explorer Page Layout and Behavior
The Data Flow Explorer page is organized as follows:
-
Threat tree
-
Detail table
-
Context tab
-
Flows tab
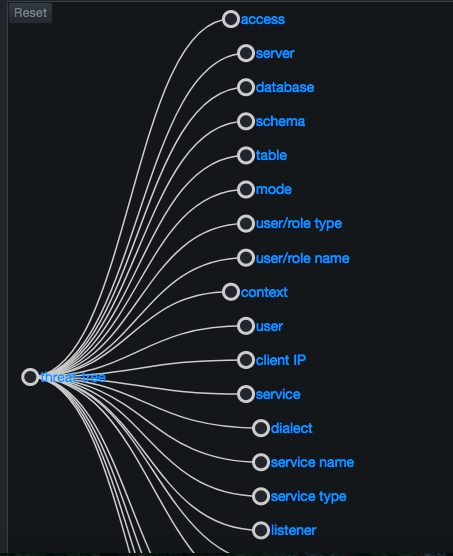
Threat Tree
The threat tree is an interactive tree diagram at the left side. The tree provides a zoomed view of the user features and value selections. The default view shows the two deepest levels of the tree from the root level. The deepest expanded node is centered vertically along the left side of the sub-page.
You can pan the tree by clicking and dragging it within the subpage. You can also zoom into and out of the tree using the same methods you use with your browser. If you pan, zoom in, or zoom out, you can use the Reset button at the top left of the page to return to the default pan and zoom settings.
Each node in the tree is represented by a circle and a label to the right of the node. Nodes are connected with links shown as solid lines following Bezier curves. Drilling down into the threat tree selects a progressively narrowing set of flows. Each action you perform updates the flow chart automatically.
When you drill down, you can click both the circle representing the node and its label.
-
Clicking an un-expanded node drills down by adding descendant children nodes to the tree and collapses any sibling nodes to the clicked node as well as any of their descendants.
-
Clicking an expanded node collapses that node and any descendants.
-
Holding down the Shift key while clicking a feature node such as “table A” or “table b” selects the node, without drilling down or collapsing it.
-
Selecting a node changes the fill color of its circle from the background color to white. It also checks the corresponding input checkbox in the detail table (also described below).
-
Selecting two or more nodes in the tree, and then clicking one of them inserts a new multi-select node into the tree temporarily, removes the selected nodes, and expands the multi-select node. The multi-select node remains in the tree as long as you do not collapse it or any of its ancestor nodes by selecting a sibling or ancestor of the multi-select node.
The root of the tree is a special node that you cannot collapse. The first level of the tree shows all available features you can select, and is shown by default.
Flow Chart
The flow chart at the top-right side uses a stacked bar chart to represent the number of new flows that came into existence at a given point in time. The data shown represents all flows that satisfy the selections you made in the threat tree. The data is binned to the range of time displayed divided by 100 or 5-minute intervals, whichever is greater.
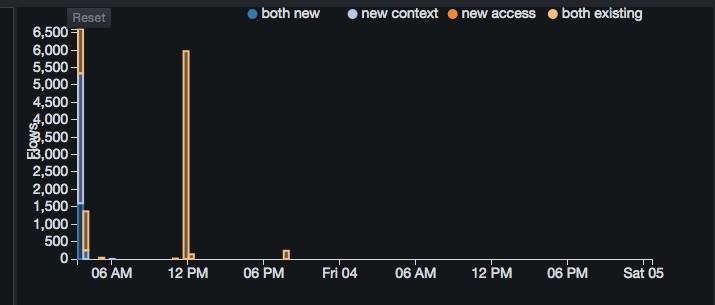
The stacked bars consist of one or more of the following four categories, stacked in the following order:
-
both new = both the access (object) and context (session) components of the flow were new.
-
new context = context was new, but the access had been observed as part of a flow at a previous time.
-
new access = access was new, but the context had been observed as part of a flow at a previous time.
-
both existing = both the access and the context components of the flow had been observed participating in other flows at a prior point in time.
The left vertical axis shows the scale for flow count. The horizontal axis is for time.
Each axis adjusts dynamically to the data being displayed. If the range of flow count values is between 0 and 800, for example, the left vertical axis shows tick marks of 0, 100, 200, and so on up to 800. However, if the range of flow count values is between 0 and 80, the left vertical axis shows tick marks of 0, 10, 20, and so on up to 80.
A legend for the flow count time series appears at the top-right corner, above the chart. The chart supports brushed zooming: Clicking and dragging within the chart area highlights the dragged region.
If you mouse up (release the mouse button), the flow chart zooms to the highlighted region. Zooming into or out of the flow chart enables the Reset button at the top-left corner above the chart. Clicking this button returns to the original zoom level of none. Zooming into the flow chart also affects which flows are shown in the Flows tab (described below).
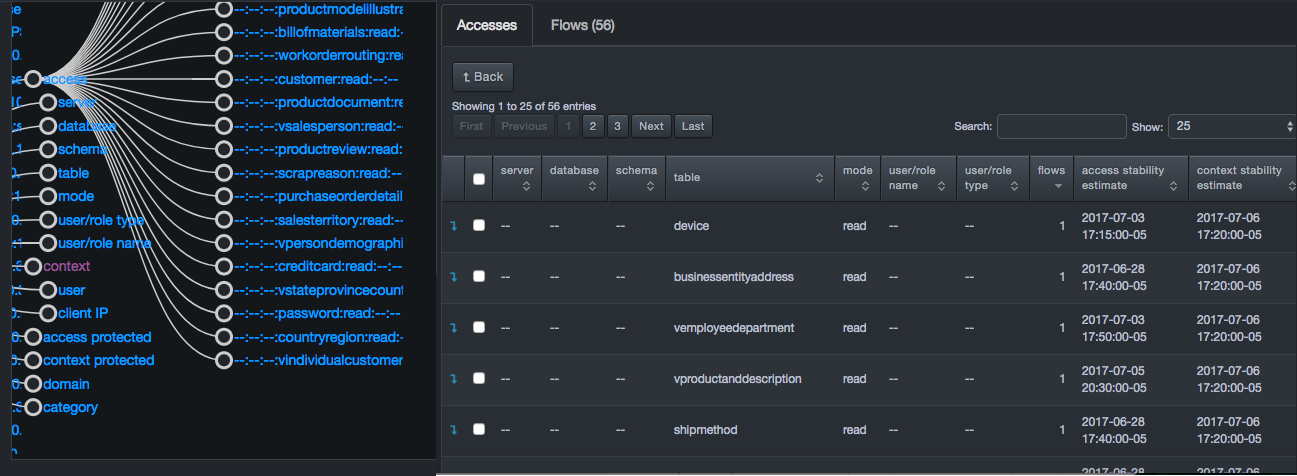
Context Tab
The bottom-right side of the page contains two tabs, a context tab on the left and a Flows tab on the right. The information shown in the context tab is based on the selection made in the threat tree. For example:
-
If you select access in the threat tree, the tab name changes to Accesses and the entries show access-specific information, such as server, database, and schema information along with access and context stability estimates.
-
If you select server in the threat tree, the tab name changes to Servers and the entries show server-specific information, such as server and flow information and access and context stability estimates.
Each entry has a drop-down arrow for drilling down. As you drill down, the system drills down to the corresponding level in the threat tree automatically.
Flows Tab
The Flows tab contains a data table and appears behind the Features tab. The number of items shown in the table defaults to 50, but can be changed to 5, 25, 100, 500, 1000, or 10000.
The tab name includes the number of flows in the Flows tab table. That number updates based on new selections in the threat tree and zoom actions in the flow chart. Two buttons above the data table allow you to add rules.
The data table contains a row for each flow matching the criteria selected in the threat tree. Initially, the Flows tab lists all flows ever observed in the system. Each row has a column for every atomic feature of a flow that has not been selected in the threat tree. Each row also has a check box for selecting the row prior to creating a policy set rule.
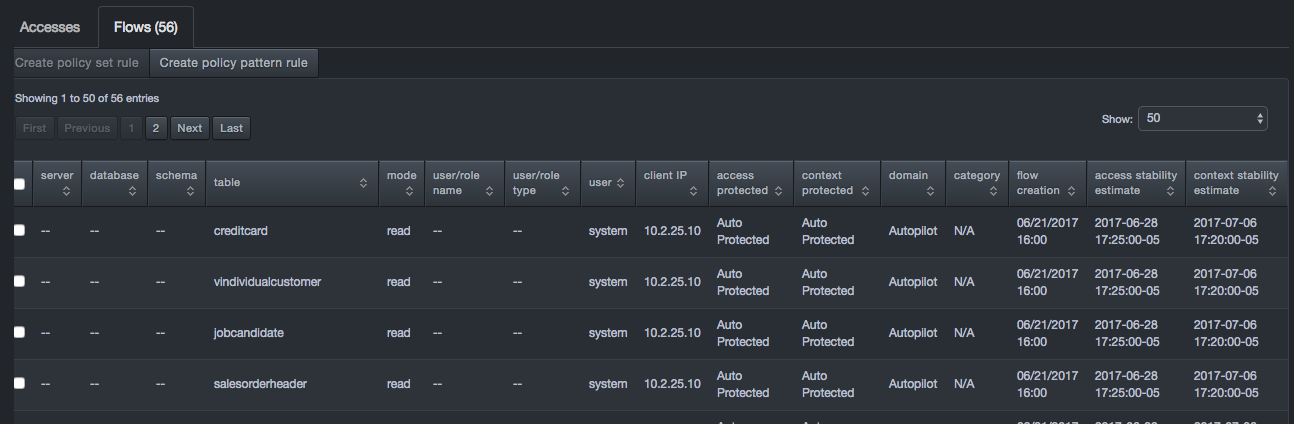
Flow Tab Buttons
| Button | Options and Description |
|---|---|
| Create policy set rule | Adds policy rules for the flows corresponding to your selections in the flows tab. Clicking this option displays a truncated version of the Create Rule page similar to the one in section 5.3.4, with options for specifying the action, category, and annotation. |
| Create policy pattern rule | Adds policy rules for the flows corresponding to your selections in the threat tree. Clicking this option displays the Advanced tab of the Create Rule screen, with a pattern representing your selections in the threat tree
|
Creating a Policy Set Rule
If you click Create policy set rule in the Flows tab, a page similar to the following appears.
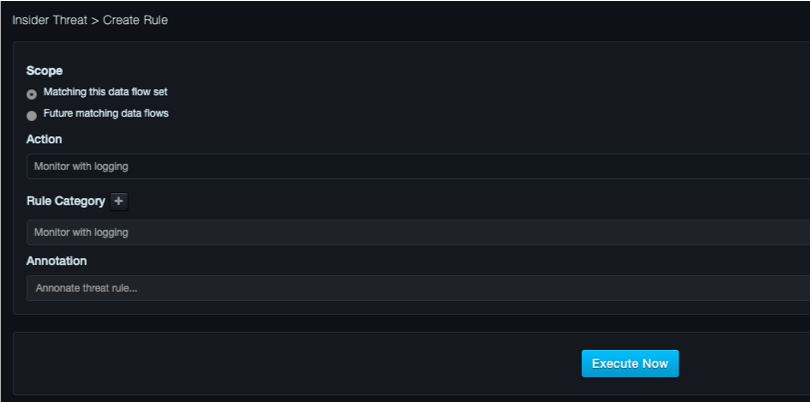
Scope Panel
The Scope panel provides the following radio buttons:
-
Matching this data flow set select this option if you want the rule to apply to just the flows matched by the rule already.
-
Future matching data flows select this option if you want the rule to apply to new flows that match the pattern of this rule.
Action Panel
When selecting a category or adding a new one, you must select the action you want performed when this rule matches a data flow.
Choices are:
-
Ignore = take no action.
-
Monitor = raise an event visible in the UI.
-
Monitor with Logging = raise an event visible in the web management interface and send a message to syslog.
Category Panel
The Category panel allows you to use a predefined category and associated action or create a new category for grouping your policy rules.
The system comes with three default categories:
-
Ignore = limits false triggers on entities in which you are not interested. Select this option if there are flows that can be ignored (for example, development environments or testing databases).
-
Monitor = select this option if the rule should generate events for you to review using the Insider Risk Analysis feature.
-
Monitor with logging = similar to Monitor with the addition that the first time a data flow matches a rule with this action or whenever the latest time a statement is executed on that data flow advances, the system writes a syslog message.
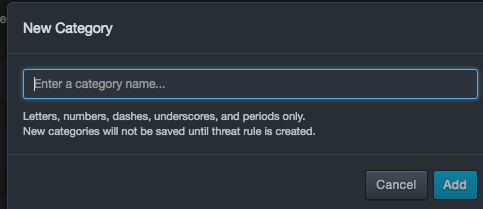
To define a new category
- Click the plus sign to the right of Category.
- When the New Category dialog ox appears, enter a name for the new category, select an action, and click Add.
Annotation Panel
The Annotation panel is a free-form field that allows you to annotate new policy rules.
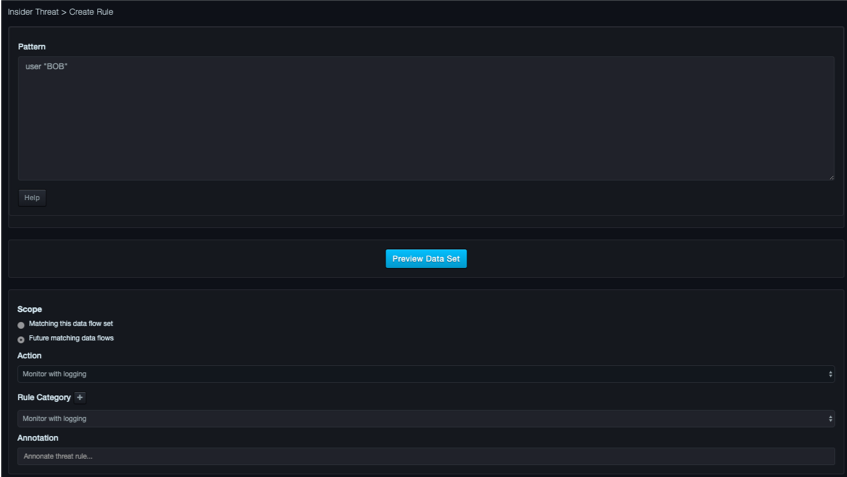
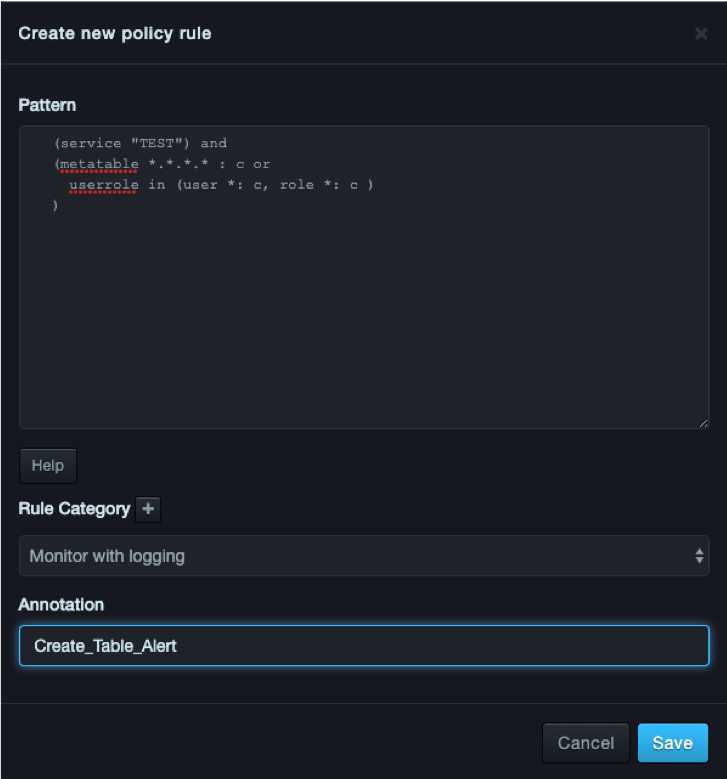
Creating a Policy Pattern Rule
If you click Create policy pattern rule in the Flows tab, a page similar to the following appears.
Pattern Panel
The Pattern panel allows you to use full Boolean logic to specify sets of values for each atomic feature of a data flow. You can also use regular expressions for features representing names, along with ranges of IP addresses or CIDR blocks for features representing IP addresses.
The following figure shows an example of the Pattern panel. Use the Preview Data Set button to display a Data Set panel below the Pattern panel, with up to 100 events shown.
Patterns use a grammar that is checked with each keystroke in the pattern editor. Patterns that do not obey the grammar cause the pane to highlight red. For more information about the grammar, click the Help button on the page.
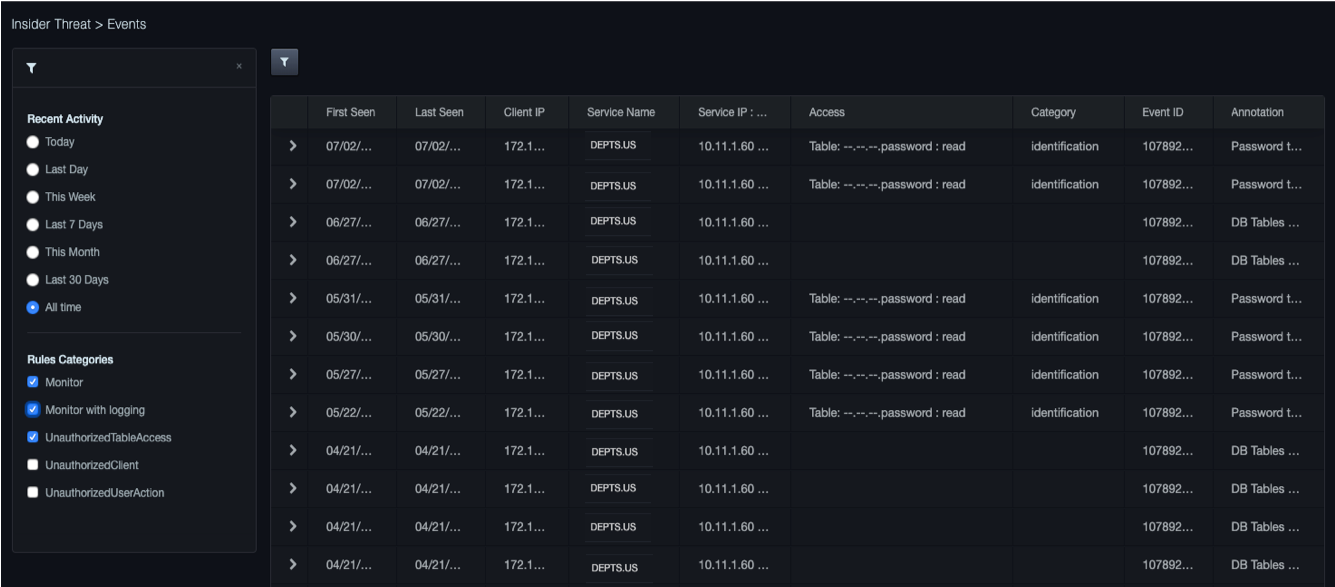
Policy Events
Path: Security > Policy Events
The Policy Events page shows any violations to user-defined policies. Events can be filtered by date received or by the rule category assigned.
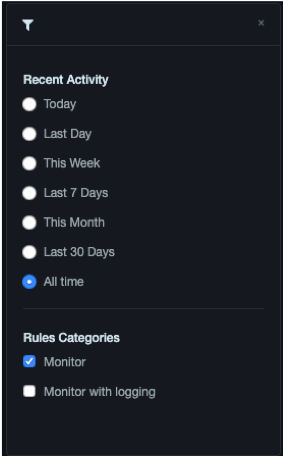
Filtering Events
Clicking the  icon next to the Flow Categorization
tab displays a panel for filtering the event activity
shown. Selecting a radio button displays only the events that correspond
to your selection. Clicking this icon again or clicking the X in the
right corner of the panel hides the panel.
icon next to the Flow Categorization
tab displays a panel for filtering the event activity
shown. Selecting a radio button displays only the events that correspond
to your selection. Clicking this icon again or clicking the X in the
right corner of the panel hides the panel.
Viewing Details
To view details about an event, click the  icon
in the left column for the event. The row expands to show the following:
icon
in the left column for the event. The row expands to show the following:
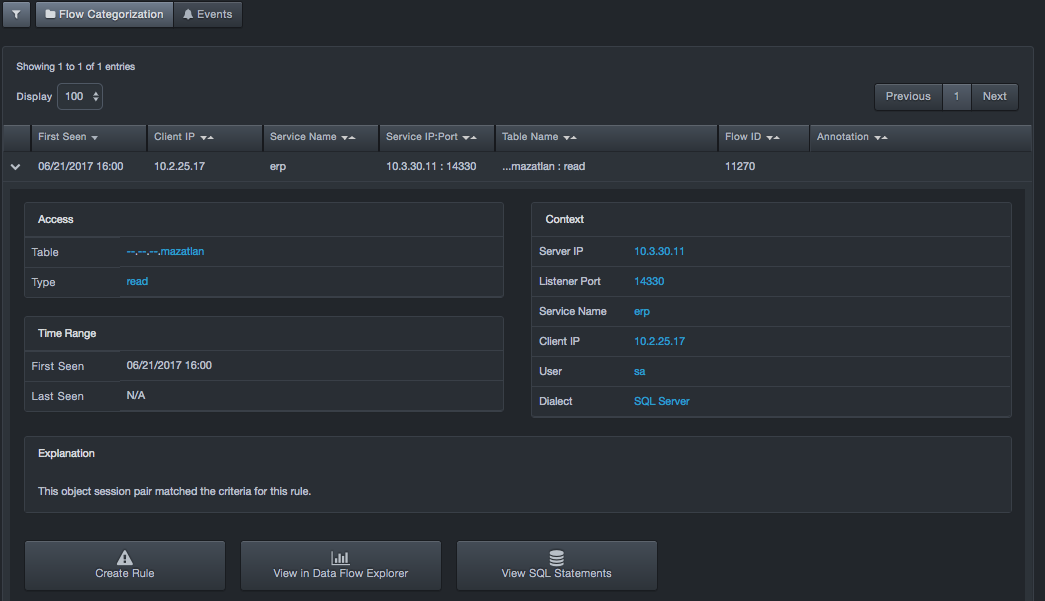
-
Data flow responsible for the event (access and context). Values for each field are clickable links that open the Data Flow Explorer.
-
Access. Provides links for viewing the database table and type in the Data Flow Explorer.
-
Time Range. The first and last date and time stamps of activity on the data flow corresponding to the event.
-
Explanation. Describes why this event was triggered. The explanation might include explanatory text and links to other pages such as the Data Flow Explorer.
-
Context. Provides links for viewing the sever IP address, listener port, service name, client IP address, user, and dialect in the Data Flow Explorer.
-
Create Rule button. Click this button to create a new rule. The new rule will change how the data flow is handled in the future.
-
View in Data Flow Explorer button. Click this button to navigate to the data flow for this event in the Data Flow Explorer.
-
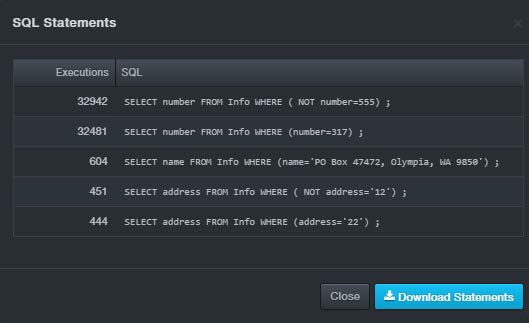
View SQL Statements button. Click this button to view the SQL statements that have been executed on the data flow for this event. A dialog box similar to the following appears. Click Download Statements to download the statements as a text (.txt) file. Click Close to close the dialog box.
Behavioral Incidents
Path: Security > Behavioral Incidents
The Behavioral Incidents page shows events that the system has detected. When the Aspecto security software detects anomalous behavior on high value assets, those assets that likely contain personal identifier information (PII), the system will create an event. The system will cluster together events into incidents to limit the number of notifications and simplify adjudication.
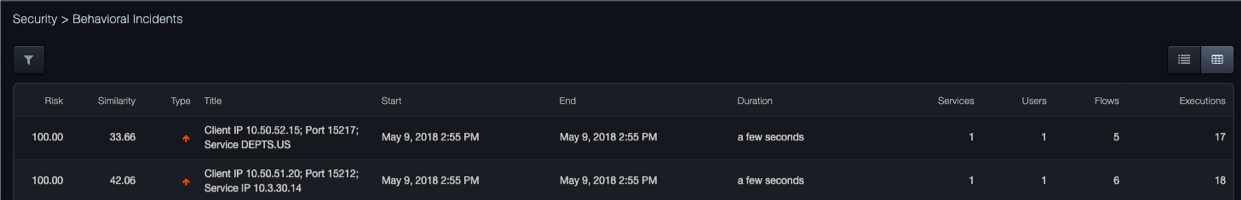
Icons at the top-right side of the page allow you to display the information in graphical or table view.
-
 displays the information in a graphical presentation.
 -
 displays the information in table format.
If there are pending rule changes, at the top-right side of the page, Switch View provides buttons for viewing incidents generated against the proposed rules and against the committed rules in the graphical or table views.
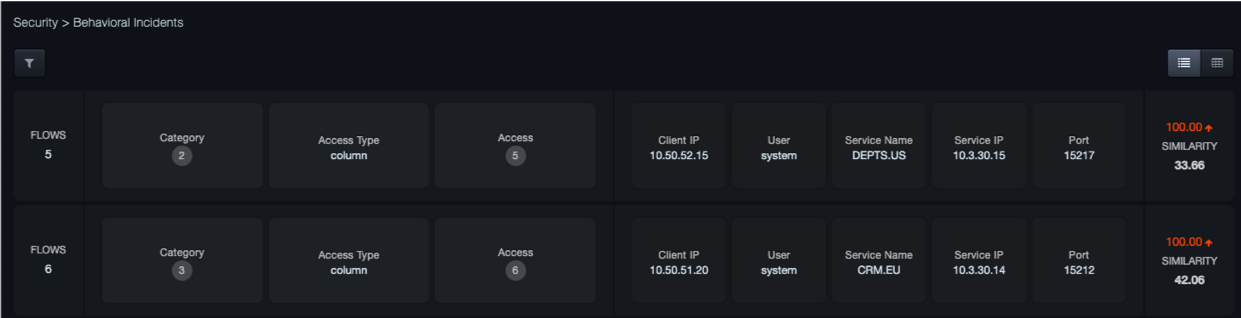
Clicking a block in the graphical view or a row in the table view displays a page similar to the following:
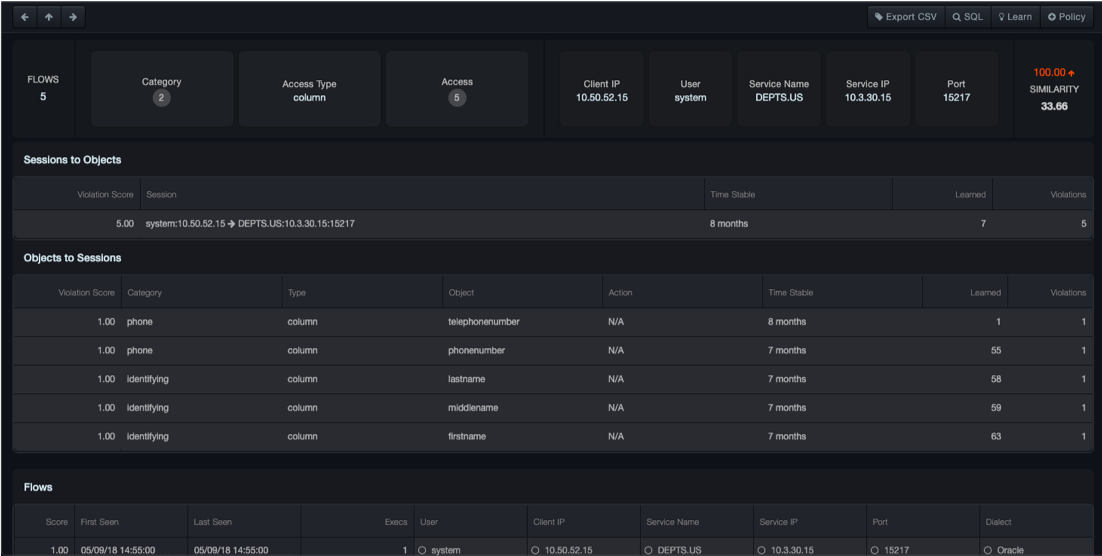
This page describes an incident in detail. The top banner repeats the incident summary the user clicks on to navigate to this page. The middle portion of the page shows three different views of the incident in question. The bottom portion of the page displays a list of data flows involved in the incident.
This page has the following elements:
-
Use the left arrow key to navigate to the previous incident listed on the Behavioral Incidents page.
-
Use the top arrow to display the Behavioral Incidents page.
-
Use the right arrow key to navigate to the next incident listed on the Behavioral Incidents page.
Banner: Each incident is described by a set of feature tiles. Each tile represents a feature of a data flow and the value or values shared in common between the data flows in the incident. The tiles are arranged from left to right in order of how important they are in tying together the data flows in an incident. That importance is also quantified by a similarity score, available by hovering over the tile. For example, the screenshot here shows the incident is characterized by 4 client IPs. Hovering over this field shows a list of the client IPs and a similarity score popup.
Sessions -> Objects tab
The Sessions -> Objects tab considers the sessions involved in the incident first and shows with which objects they interacted.
Objects -> Sessions tab
In contrast, the Objects -> Sessions tab considers the objects involved in the incident first and shows with which sessions they interacted.
Selectivity tab
-
The first two tabs display a burst diagram on the left side. This is a map of the incident. High opacity sections of the map correspond to data flows in the incident. Low opacity sections correspond to previous stable activity for the session or object whose stability was violated. The map consists of concentric rings. Each ring represents a feature of a data flow. The rings are partitioned into sections for each value the corresponding feature takes on. Hovering over the sections of this chart highlights the corresponding row (User, Client IP, and so on) in the legend to the right of the figure.
-
The table to the right of the burst diagram lists the details about the sessions or objects whose stability was violated.
Data Flow Information
| Column | Description |
|---|---|
| Score | Risk score that represents a measure of the risk for stability violations. The higher the number, the greater the risk. |
| First Seen | Date and time when a behavioral event was first seen by DBC Platform. |
| Last Seen | Date and time when a behavioral event was last seen by DBC Platform. |
| Execs | The number of statement executions associated with the data flow in this incident. |
| Data Flow features … | The value of a feature (for example, a user or client IP associated with the data flow). See the Note below. |
Clicking a cell in the Grid displays a check mark in the cell and to the right of the SQL button at the top-right area of the page. You can then use the Learn button to have the system learn your selection, or the Policy button to add your selection to the system policy. Multiple selections can be made at the same time.
Rule Management
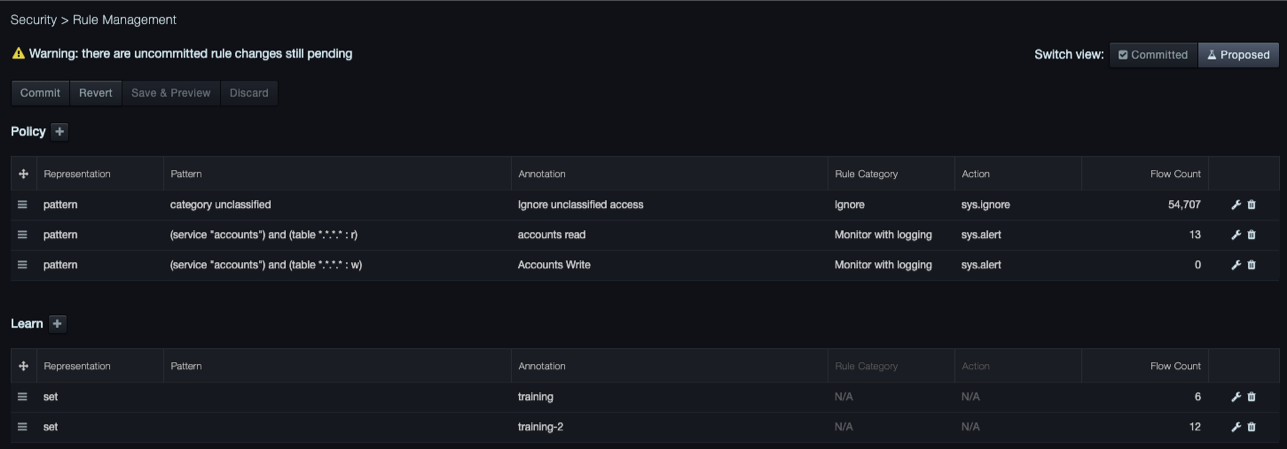
Path: Security > Rule Management
The Rule Management page allows you to manage rules defined for the DBC Platform. The page is organized into two areas described below with an optional third panel if there are settings changes pending.
-
Policy shows the policy rules that were defined on the Behavioral Incidents page or from the Data Flow Explorer.
-
Learn shows the learned rules that were defined on the Behavioral Incidents page.
Using the Rule Management page, you can:
- Add new policies
- View and edit policy rules and learned rules
- Reorder policy rules and learned rules
- Give some edits or reordering, save and preview, or discard those changes
- Commit or revert the current changes.
If there are already uncommitted changes, at the top-right side of the page, Switch View provides buttons for viewing proposed and committed rule sets.
 |
Note: If there are uncommitted rule changes that are pending, a message appears on the page. |
Fields in the Rule Management Page
| Field | Description |
|---|---|
| Representation | Specifies whether the rule is set- or pattern-based |
| Pattern | A preview of the pattern, if applicable, used to define the rule |
| Annotation | An optional label for the rule, entered by the user |
| Rule Category | A rule grouping. There are three defaults corresponding to each of the three available rule actions: Ignore, Monitor, or Monitor with Logging |
| Action | The action the system will take if the policy is triggered |
| Flow Count | The number of flows affected by the rule (Note that higher precedent rules can shadow lower percent rules, so this count can be zero) |
| Edit/Trash | Select the wrench to edit, the trash bin to delete the policy |
Creating a Policy
Using the Rule Management page you can add security policies to the system
-
To create a rule
-
Navigate to Security > Rule Management.
- Click the plus
 button next to Policy.
 - Enter the pattern the system will search for
- Determine if the system will ignore, monitor, or monitor with logging (via syslog)
- Give the policy a name
Editing Rules
Using the Rule Management page you can edit rules.
-
To edit a rule
-
Navigate to Security > Rule Management.
-
Under Policy or Learn, double-click the
 icon next to the rule you want to edit.
 -
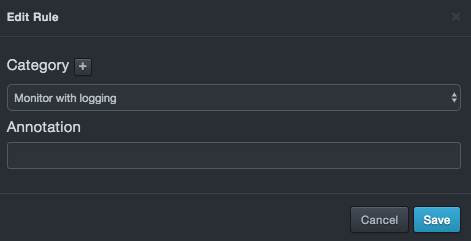
If you clicked a policy, a dialog box similar to the following appears. Change the category and/or annotation name, and then click Save.
-
If the rule is pattern based, you can additionally edit the pattern.
-
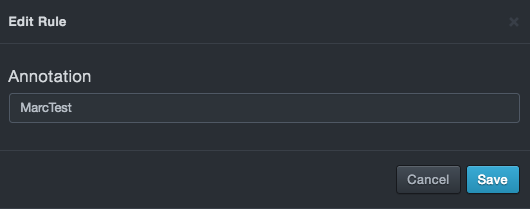
If you clicked a learn rule, a dialog box similar to the following appears. Enter or change the annotation name, and then click Save.
-
If the rule is pattern-based, you can additionally edit the pattern.
Reordering Rules
The order that rules appear under the Policy and Learn areas of the Rule Management page is the order in which the DBC Platform appliance considers them when evaluating a new data flow. The topmost rule in these areas is executed first followed by the rules below it. If the rules under Policy and Learn do not appear in the desired order, reorder them.
To reorder a rule
-
Click Security > Rule Management.
-
Under Policy or Learn, click the
 icon next to the rule you want to reorder, and then drag up or down.
 -
When the rule is at the desired location, release the mouse button.
Deleting Rules
If you no longer need a rule, you can delete it from the Rule Management page.
|
Note: A precautionary message does not appear when you delete a rule. Therefore, be sure you do not need a rule before you delete it. |
To delete a rule
-
Click Security > Rule Management.
-
Under Policy or Learn, click the trash bin
 icon next to the rule you want to delete.
Committing Rules
After you define policy and learn rules, you must commit them to have them take effect.
To commit rules
-
Click Security > Rule Management.
-
At the top-left side of the page, click the Commit button.
-
When the Confirmation message appears, click Commit.
Reverting Rules
Using the Revert button, you can revert DBC Platform to the last commit operation.
To revert rules to the last commit operation
-
Click Security > Rule Management.
-
At the top-left side of the page, click the Revert button.
-
When the Confirmation message appears, click Revert.
Saving and Previewing Rules
Using the Save & Preview button, you can save and preview policy and learn rules edits or reordering.
To save and preview rules
-
Click Security > Rule Management.
-
At the top-left side of the page, click the Save & Preview button.
-
When the Confirmation message appears, click Save & Preview.
Discarding Rule Changes
Using the Discard button, you can discard changes to the policy and learn rules on this page. If you discard changes, all changes since the last save operation will be lost.
To discard rules
-
Click Security > Rule Management.
-
At the top-left side of the page, click the Discard button.
-
When the Confirmation message appears, click Discard.
Settings
Path: Security > Settings
The Settings page contains simple and advanced auto-protect settings. There are two categories of settings you can configure: simple and advanced. The Type button allows you to access these settings. Initially, simple settings are shown by default.
|
Note: If there are uncommitted rule changes that are pending, a message appears on the Risk Management page. |
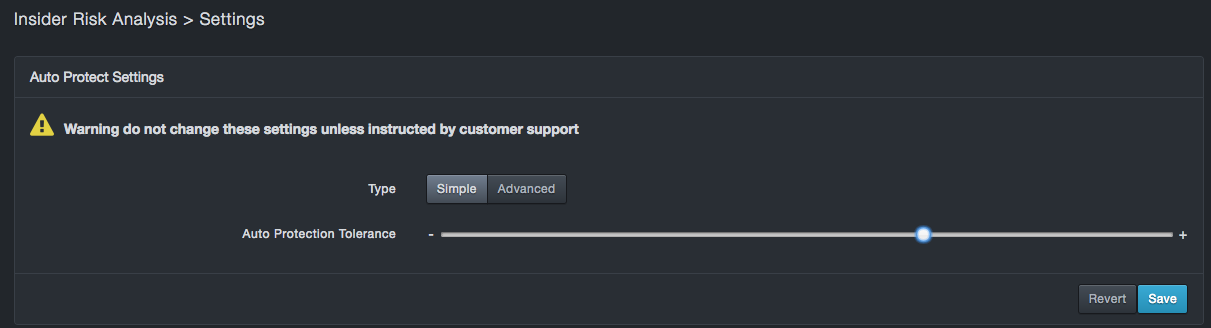
Simple Settings
Under simple mode the user can change the "Auto Protection Tolerance". This is the primary knob for configuring the Auto Pilot. Each new data flow that does not match a user-specified constraint (for example, a policy rule) is scored by the autopilot. A higher score is indicative of an unexpected data flow. Risk scores above the auto protection threshold generate high risk events and syslog entries. Risk scores above a lower risk threshold (see advanced mode) also generate behavioral events, but these can be reconsidered by the Auto Pilot. High risk events cannot. If you change this setting, click Save to have the setting take effect.
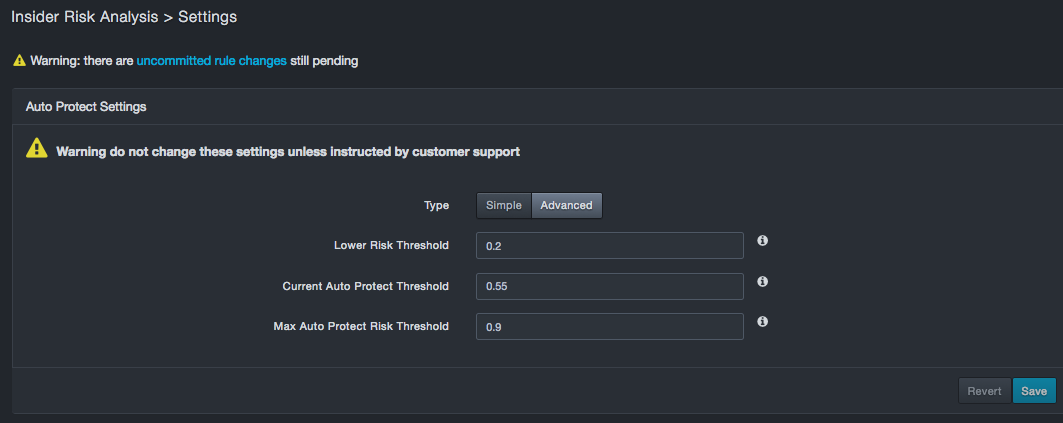
Advanced Settings
Use the Advanced button to display advanced settings. Do not change these settings unless instructed by DB CyberTech Technical Support. If you change these settings, click Save at the bottom-right side of the page to have them take effect.
Fields in the Advanced Settings Page
| Field | Description |
|---|---|
| Lower Risk Threshold | Risk scores below this threshold are considered normal behavior for auto protection. This field accepts a numeric value of 0 through 1 and a value less than the Max Auto Protect Risk Threshold. |
| Current Auto Protect Threshold | Read-only field that shows the current auto pilot threshold. |
| Max Auto Protect Risk Threshold | Risk scores above this threshold generate events and syslog entries. This field accepts a numeric value of 0 through 1 and a value less than the Lower Risk Threshold. |
Reporting Menu
| This chapter describes the options in the Reporting menu. |
Custom Reports
Path: Reporting > Custom Reports
The Custom Reports page allows you to generate reports about insider threat functionality.
Each custom report can be downloaded as a file in CSV format.
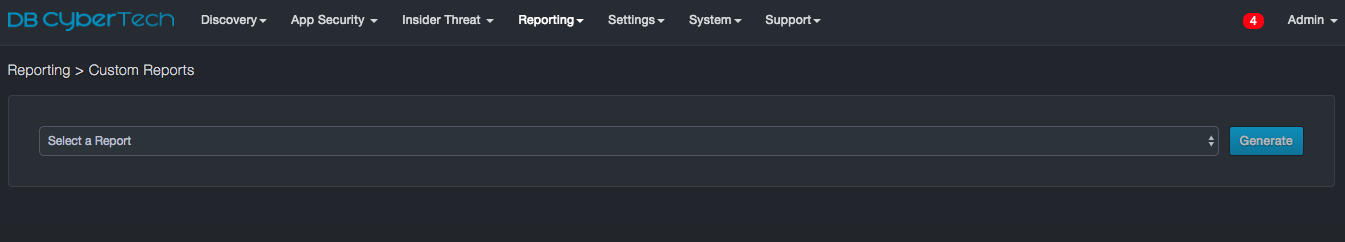
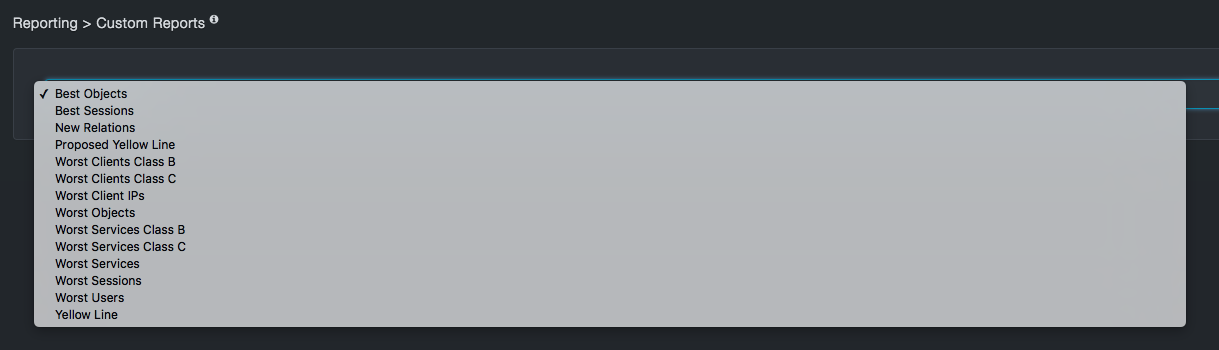
Table Columns in the Flow Categorization Tab
| Report | Description |
|---|---|
| Best Objects | List of objects with the longest elapsed time since a new flow with that object came in and at least 10 flows. These are good candidates for testing violations of object stability. |
| Best Sessions | List of sessions with the longest elapsed time since a new flow with that session came in and at least 10 flows. These are good candidates for testing violations of object stability. |
| New Relations | List of newest relations seen across all traffic and counts of how many flows, services, client IPs and sessions involved these relations. |
| Proposed Yellow Line | The history of the auto pilot's setting between low risk (yellow) and high risk (red) events for the proposed transaction, if it exists. |
| Worst Clients Class B | List of client class B networks with the least client stability and metrics to characterize how unstable they are. |
| Worst Clients Class C | List of client class C networks with the least client stability and metrics to characterize how unstable they are. |
| Worst Clients IPs | List of client IPs with the least stability and metrics to characterize how unstable they are. |
| Worst Objects | List of objects with the least stability and metrics to characterize how unstable they are. |
| Worst Services Class B | List of service class B networks with the least service stability and metrics to characterize how unstable they are. |
| Worst Services Class C | List of service class C networks with the least service stability and metrics to characterize how unstable they are. |
| Worst Services | List of service names with the least service stability and metrics to characterize how unstable they are. |
| Worst Sessions | List of database sessions with the least stability and metrics to characterize how unstable they are. |
| Worst Users | List of users with the least stability and metrics to characterize how unstable they are. |
| Yellow Line | The history of the auto pilot's setting between low risk (yellow) and high risk (red) events for the committed transaction. |
Contact Technical Support
For any technical difficulties you may experience, you can contact DB CyberTech Technical Support at the following:
Email: support@dbcybertech.com
Phone: 1(800) 375-0592
Appendix A-Z Glossary
Glossary
| Term | Definition |
|---|---|
| API | Application Programming Interface. A set of routines, protocols, and tools for building software applications. |
| Blacklisted statements | Statements that are not added to the learned set. Typically, these statements are used to filter out benign statements generated by DBAs or other non-application related interactions |
| BPF | Berkeley Packet Filter. An architecture for user-level packet capture. BPF provides a raw interface to data link layers in a protocol-independent fashion. |
| CAC | A "smart" card about the size of a credit card used as identification for active duty uniformed service personnel, Selected Reserve, DoD civilian employees, and eligible contractor personnel. |
| CSV | Comma-separated value. Data format where each piece of data is separated by a comma. |
| DHCP | Dynamic Host Protocol Configuration. A standardized network protocol used on Internet Protocol networks to dynamically distribute network configuration parameters, such as IP addresses, for interfaces and services. With DHCP, computing devices like your DBC platform request IP addresses and networking parameters automatically from a DHCP server, reducing the need to configure these settings manually. |
| DNS | Domain Name System. A hierarchical decentralized naming system for computers, services, or any resource connected to the Internet or a private network. DNS translates domain names into the numerical IP addresses to locate and identify computer services and devices with the underlying network protocols. |
| LDAP | Lightweight Directory Access Protocol. A protocol for accessing a directory listing in a TCP/IP network. It is a sibling protocol to HTTP and FTP and uses the ldap:// prefix in its URL. |
| Learned set | Contains statements considered to be part of the application’s normal behavior. |
| MAC | Media Access Control. A hardware address that uniquely identifies each node of a network. |
| MTU | Maximum Transmission Unit. The largest physical packet size measured in bytes that a network can transmit. Any messages larger than the MTU are divided into smaller packets before being sent. |
| Network File System | A client/server application that allows network users to access shared files stored on computers of different types using a Virtual File System that runs on top of TCP/IP. |
| NTP | Network Time Protocol. A networking protocol for clock synchronization between computer systems over packet-switched, variable-latency data networks. |
| pcap | Short for packet capture. A program for capturing network traffic. |
| Server Message Block | A message format used by Windows to share files, directories, and devices. |
| SSL | Secure Sockets Layer. A protocol for transmitting private documents via the Internet. SSL uses a cryptographic system that uses two keys to encrypt data. |

DB CyberTech
15015 Avenue of Science
Suite 150
San Diego, CA 92128
http://www.dbcybertech.com